ApiPulse Analytics
High-Fidelity Real-Time API Telemetry & Posture Monitoring
Live Recording & Interactive Gallery

Project History & Context
ApiPulse was conceived to address a recurring bottleneck in modern server operations: visual lag and query latency when rendering high-frequency API event logs. Traditional logging portals rely on heavy polling or delayed batching, meaning operations teams see errors minutes after they occur. ApiPulse implements a zero-delay local state buffer that updates React canvas and SVG layout nodes smoothly. This system provides a comprehensive telemetry console that allows teams to see precisely how endpoints are performing in real-time.
Core capabilities & interface details
API Performance Executive Hub
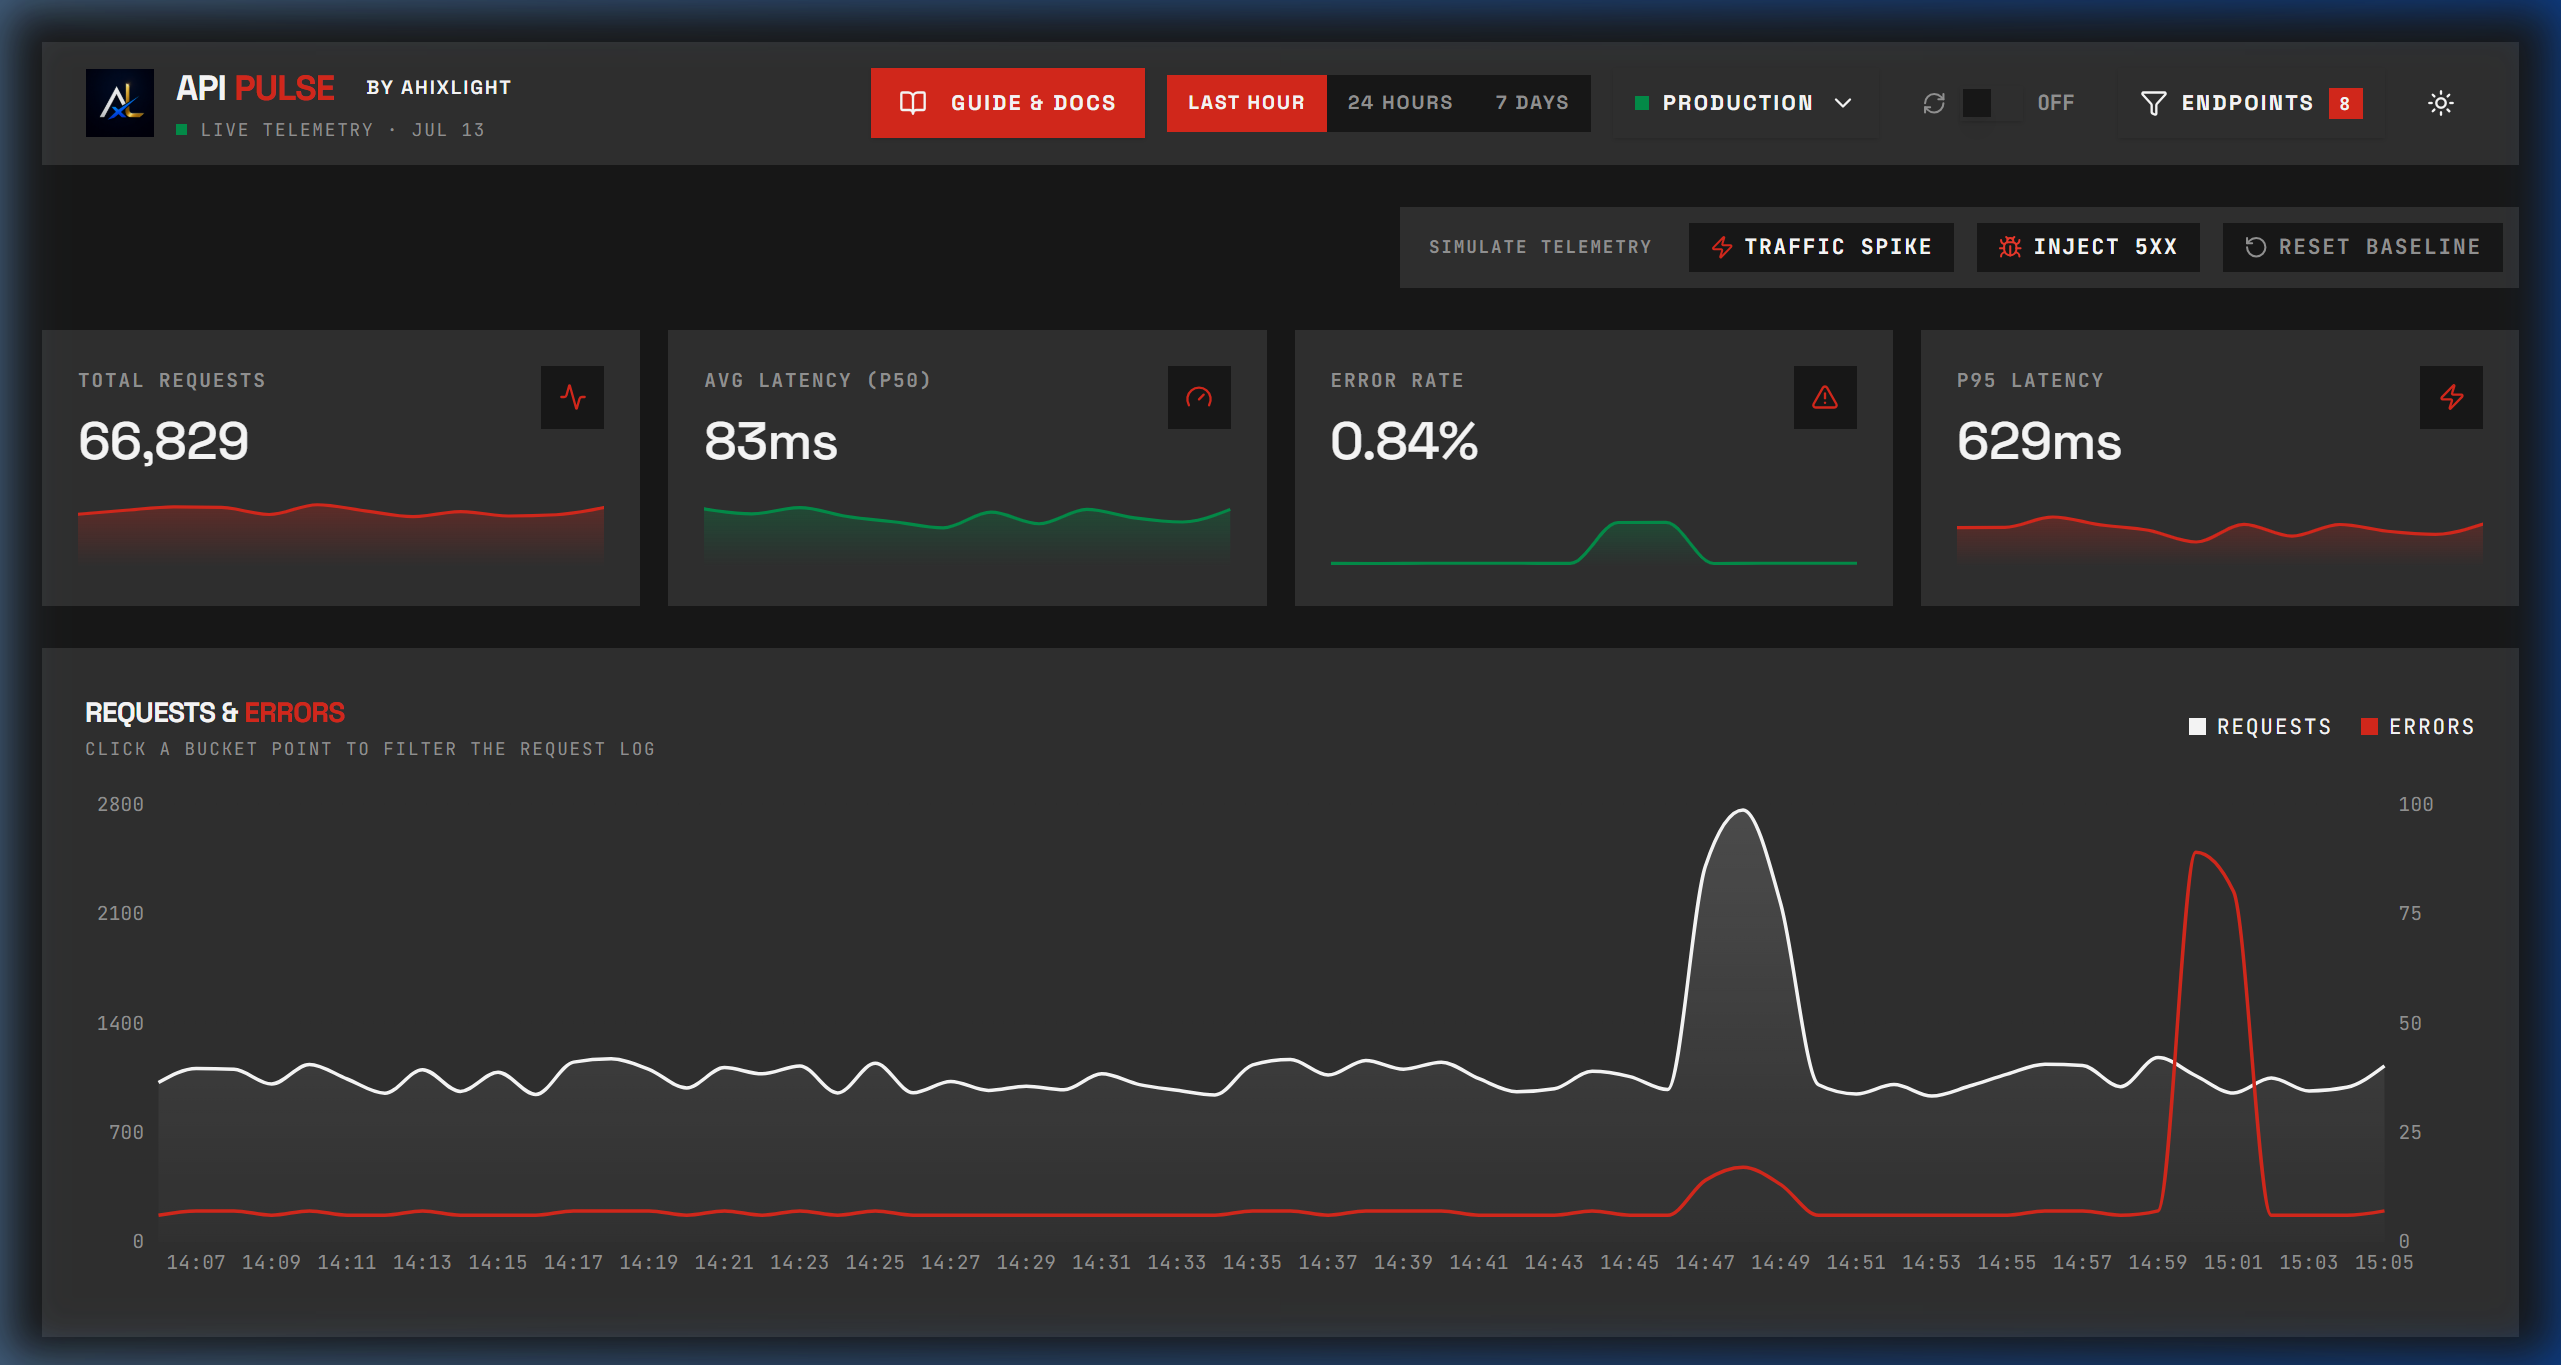
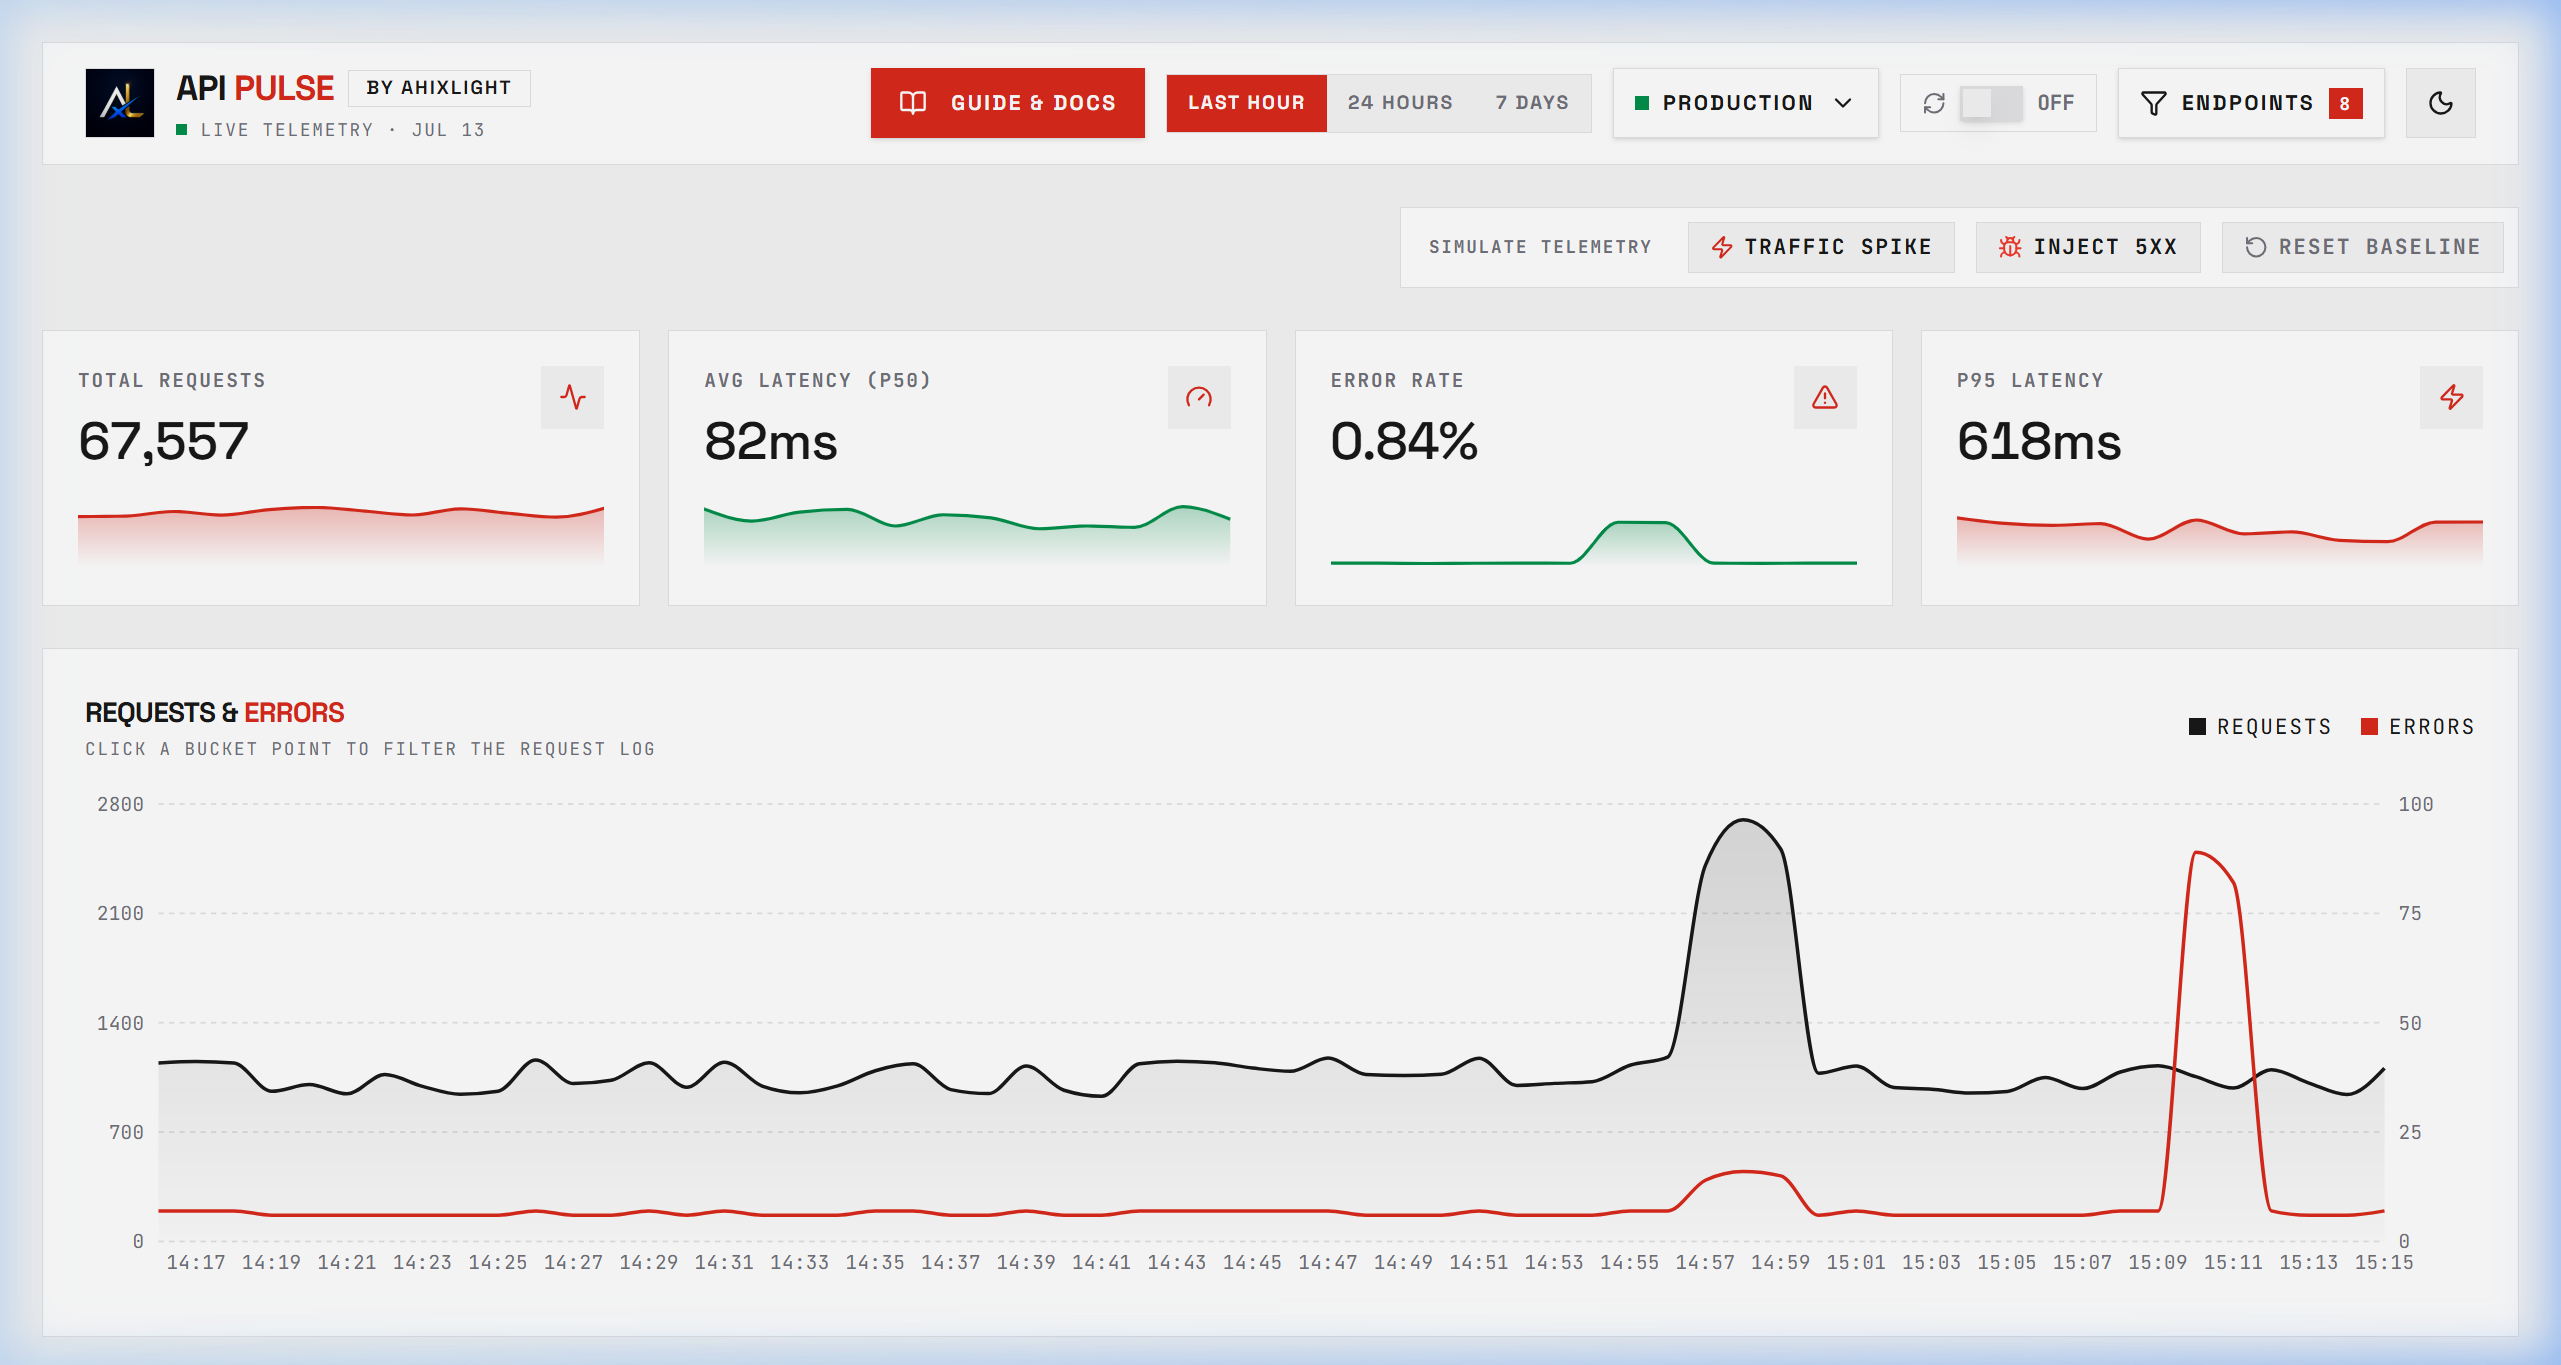
The primary monitoring dashboard compiles high-level KPIs, error rate calculations, and volume charts in a clean glassmorphic grid.
- ▪Real-time calculation of active requests per second.
- ▪Dynamic visual alerts when error rates exceed safe percentage thresholds.
- ▪High-frequency chart animations built completely using vanilla CSS.
Microsecond Latency Percentiles
An interactive charting widget tracking request latency over custom ranges, isolating p50, p95, and p99 server response indicators.
- ▪Precise hover points showing exact timestamps and latency measurements.
- ▪Interactive filters to toggle specific metrics on and off without page reloads.
- ▪SVG clipping paths ensuring smooth rendering of high-frequency data streams.
Real-Time Trace Logs & Simulation Console
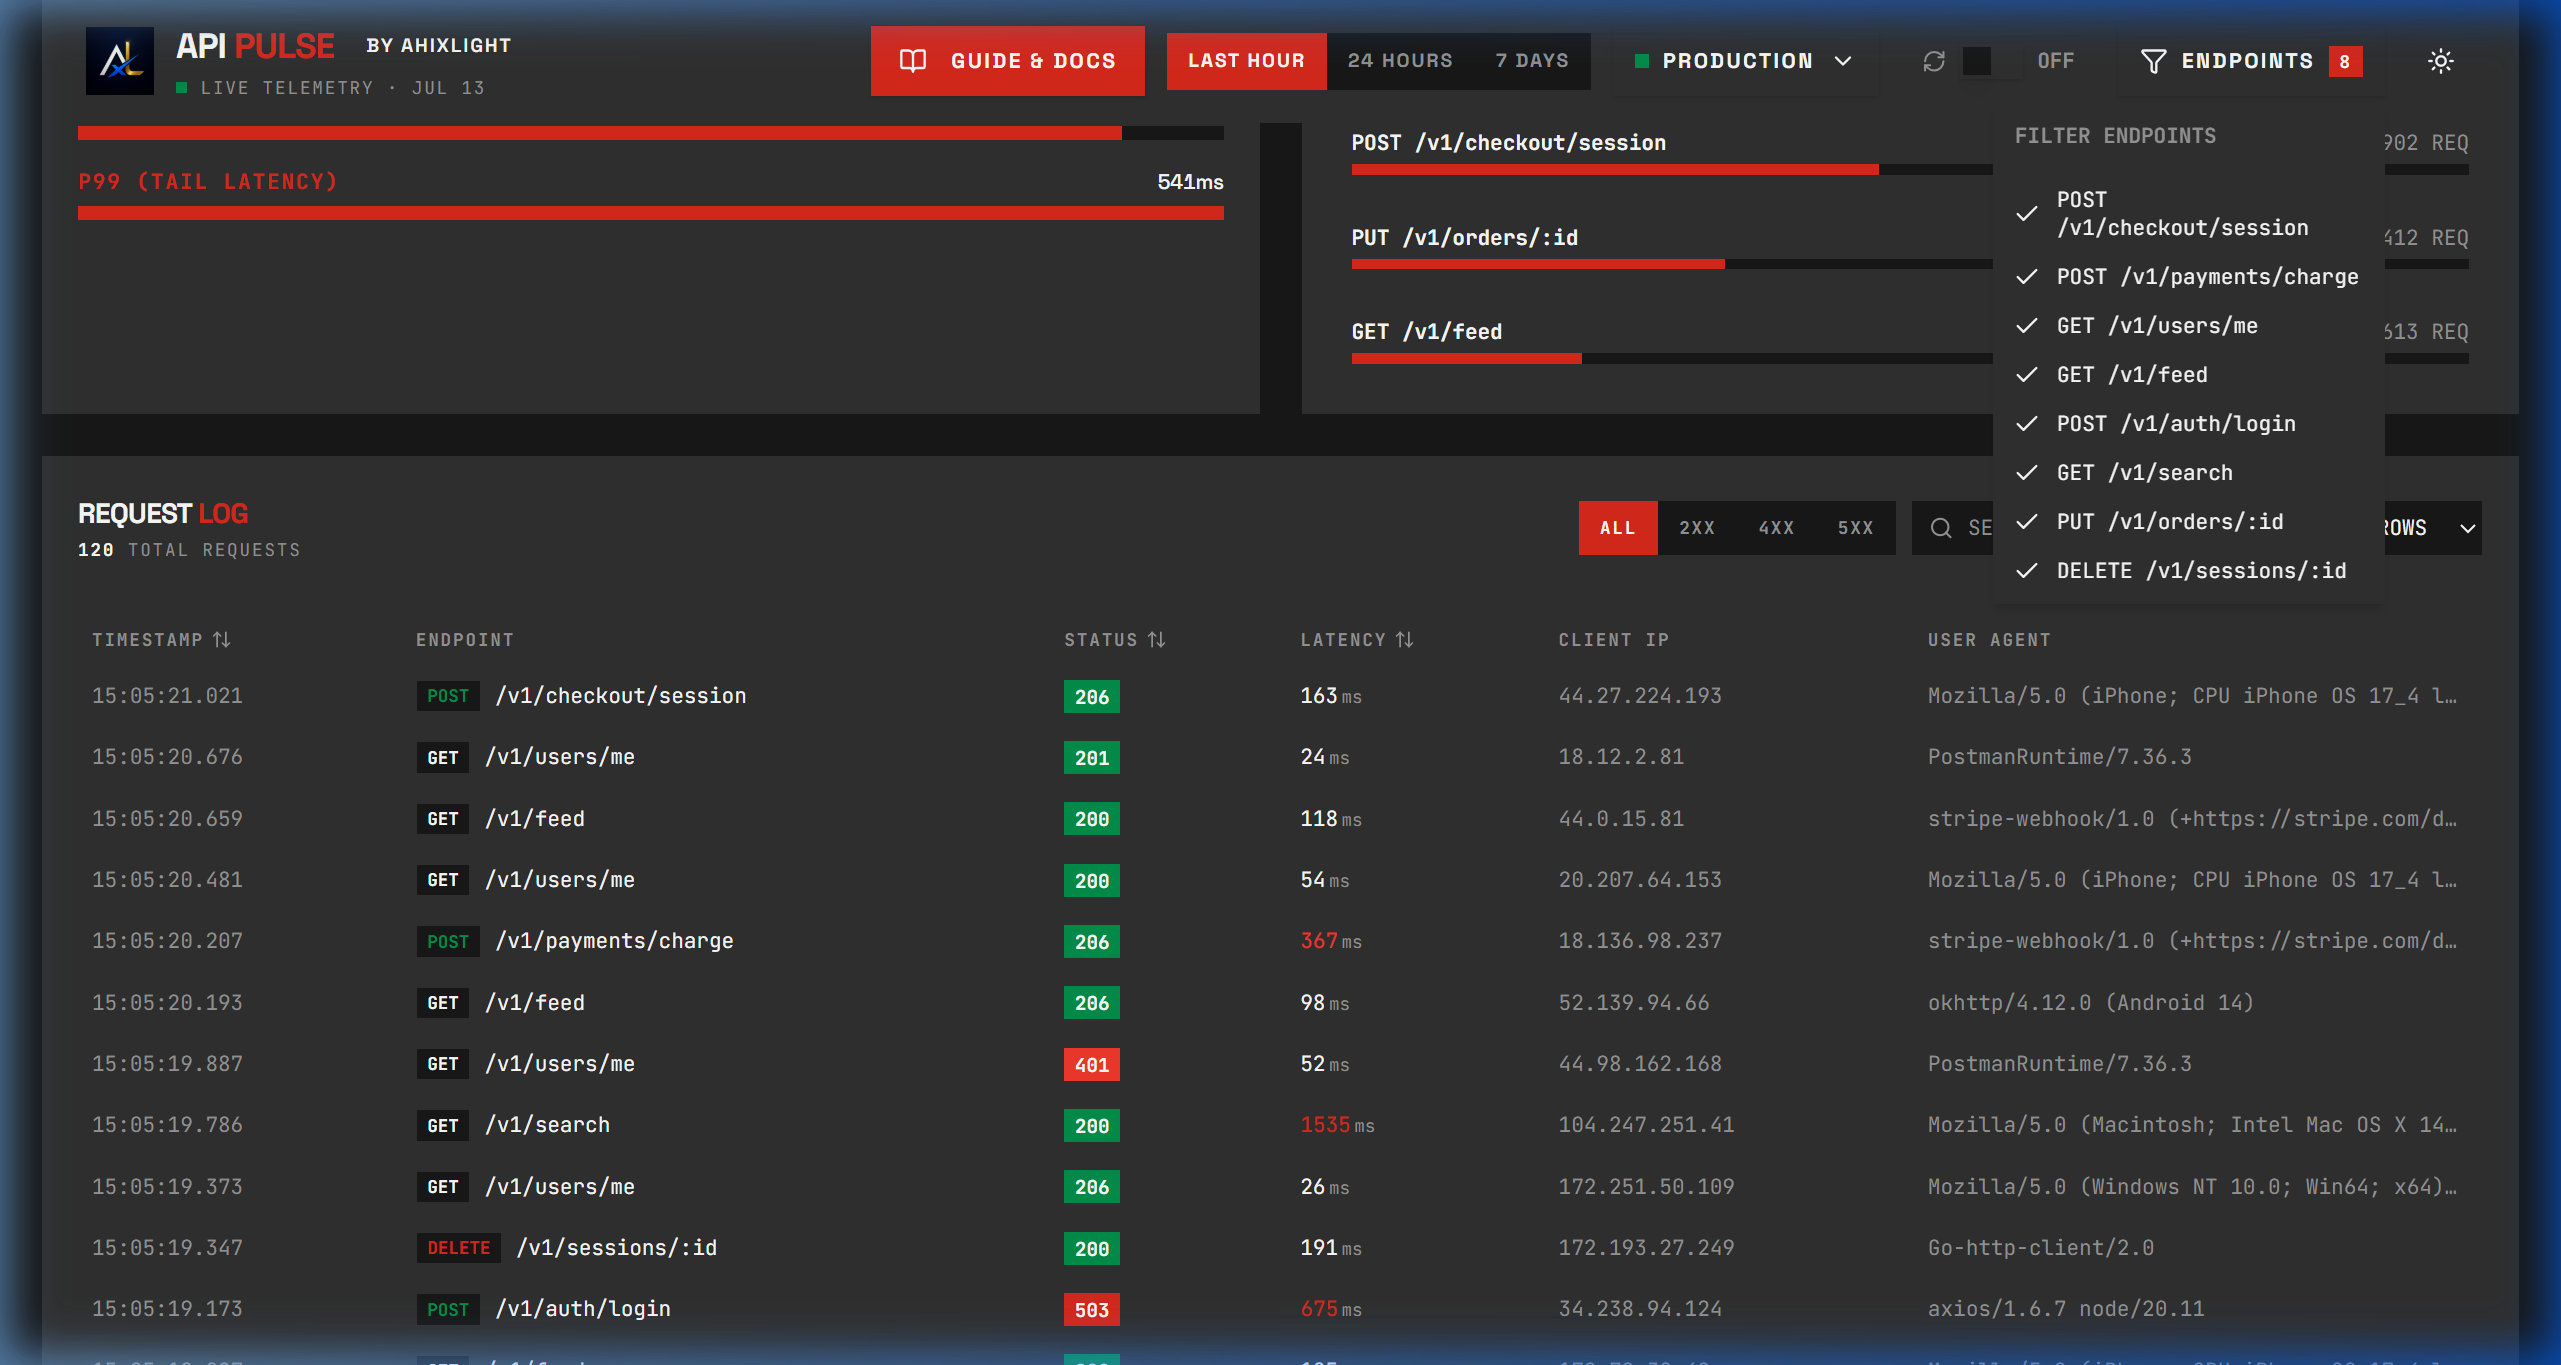
A streaming log feed representing incoming API queries, complete with status codes, latency scores, and trace identifiers.
- ▪Interactive trace simulation trigger simulating traffic surges.
- ▪Search filtering to query logs by status code or specific HTTP methods.
- ▪One-click log row inspection displaying comprehensive request trace waterfalls.
The Architectural Problem
Engineering teams frequently struggle with fragmented monitoring tools, resulting in delayed incident responses and blind spots in live database write operations and latency anomalies.
The Implemented Solution
ApiPulse consolidates metrics, network tracing, and database verification into a single, high-fidelity real-time telemetry dashboard using optimized React renders and SVG widgets.
Functional Specifications
- [01]
Real-time event streaming and logging console with pause/resume controls.
- [02]
Microsecond-accurate latency histograms and percentile metrics (p95, p99).
- [03]
Interactive timeframe filtering with zero-latency visual re-rendering.
- [04]
Live mock alert system representing server and endpoint failures.
Systems Architecture
Front-End Client: Next.js App Router for server-rendered page foundations and static optimization.
Telemetry Engine: High-speed local state management pushing live event updates into virtualized log streams.
Visualization layer: Recharts-powered responsive SVG components built on top of customized CSS grid containers.
HAVE A SYSTEM TO DESIGN?
We scope and build custom web applications, advanced data visualization systems, and stateful AI dashboards in under 3 weeks.
LET'S DISCUSS YOUR PROJECT