Executive Business Intelligence Platform
Unified Executive Cockpit & Conversational Data Queries
Live Recording & Interactive Gallery

Project History & Context
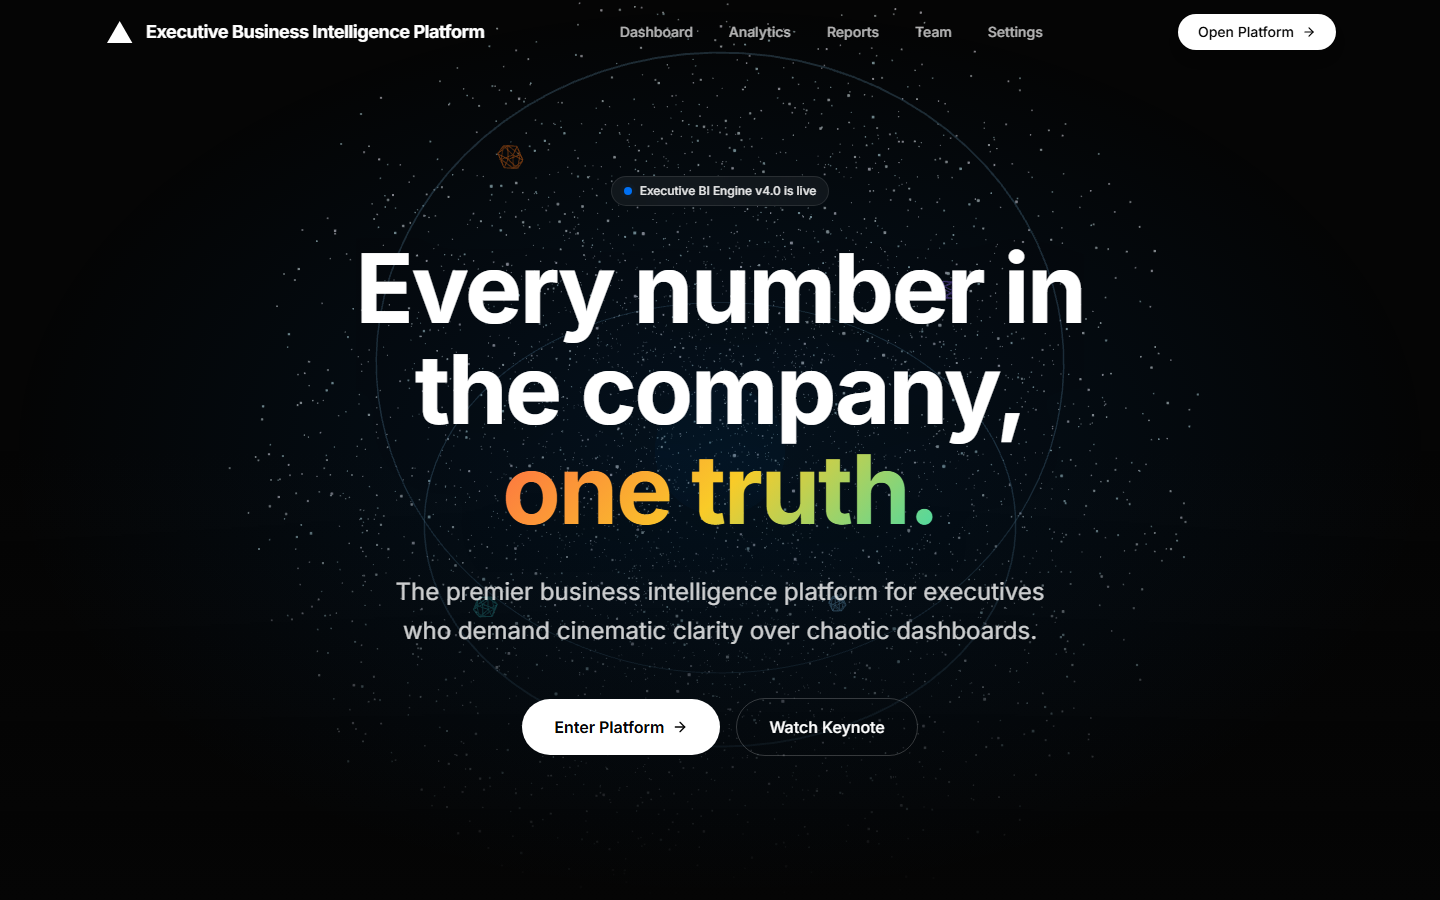
Vanguard Executive BI was designed to simplify data-driven leadership. The platform consolidates high-level financials, marketing ROI, operations telemetry, and team accountability logs in a single glassmorphic cockpit, allowing leaders to monitor performance and make decisions in real-time.
Core capabilities & interface details
Executive Command Cockpit
The primary control dashboard summarizing corporate metrics, monthly revenue trends, and operational margin cards.
- ▪Consolidated KPI widgets tracking Total Revenue, Active Users, margins, and NPS.
- ▪Dynamic bar charts detailing monthly revenue yields against expectations.
- ▪Timeframe toggles filtering metrics by 1W, 1M, 1Q, YTD, 1Y, or ALL ranges.
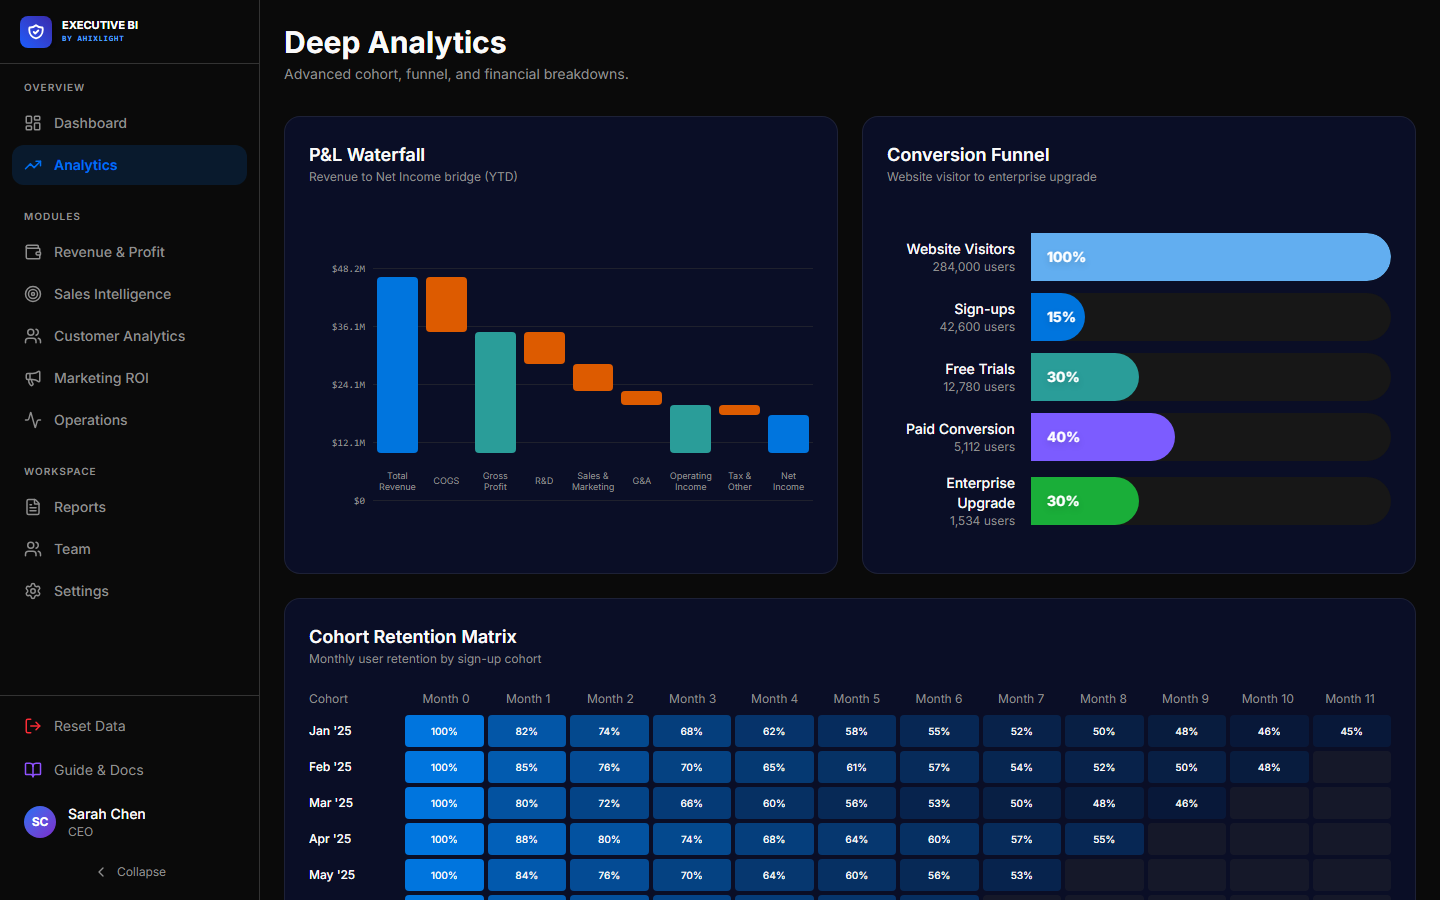
Revenue Performance Analytics
An advanced visualization layout plotting corporate revenue trends, regional distributions, and margin curves.
- ▪Interactive line charts tracking monthly revenue developments and forecasts.
- ▪Pie charts displaying client allocations by geography or product line.
- ▪Hover analytics displaying exact financial targets per database point.
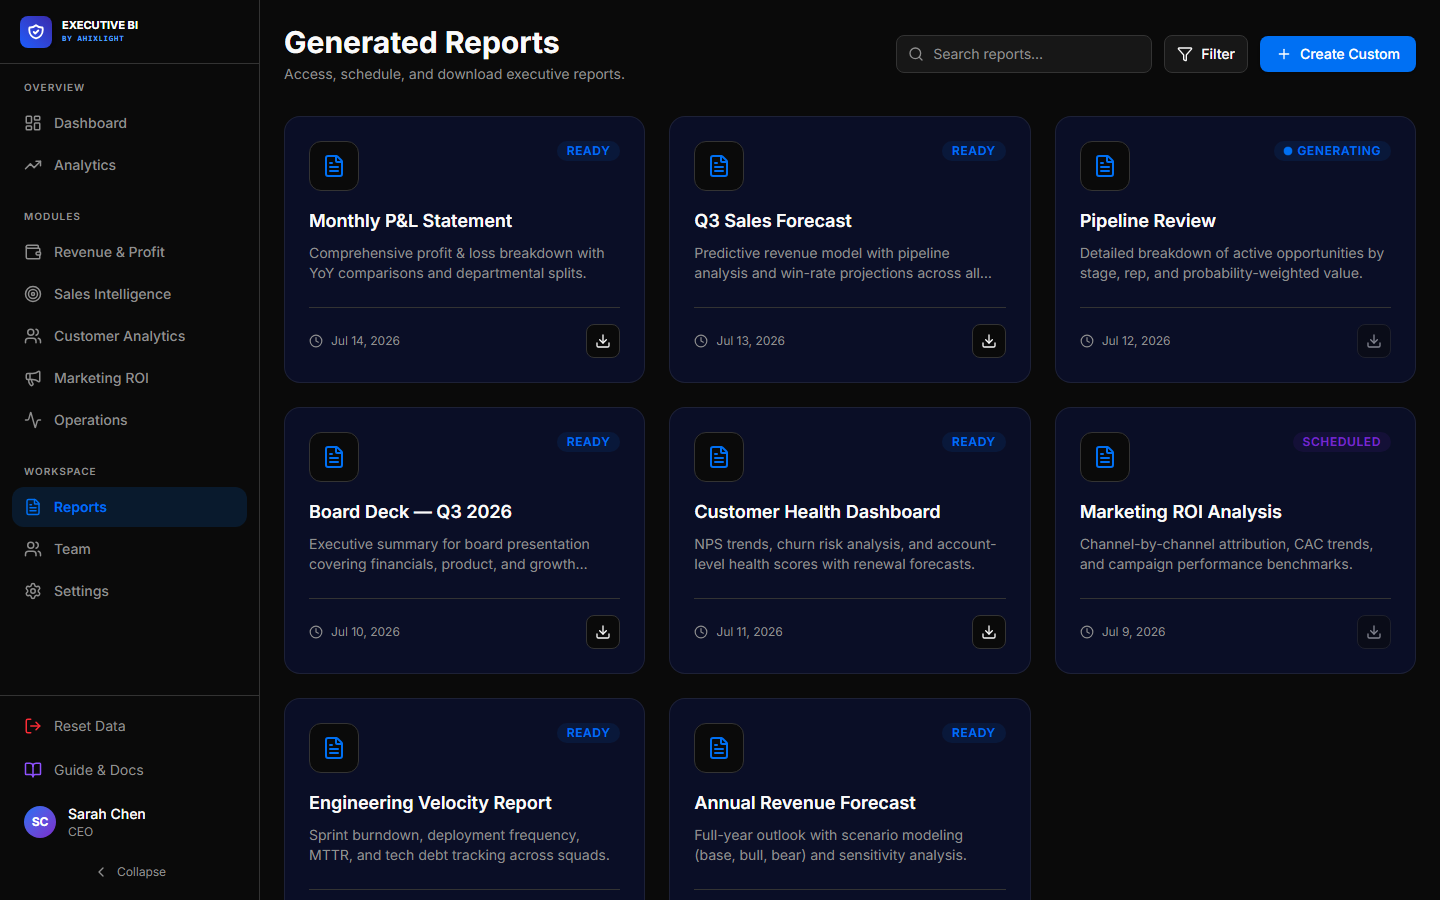
Interactive Reports Builder
A reports development workspace generating telemetry databases, query filters, and export templates.
- ▪Data tables listing operations metrics, transaction details, and margins.
- ▪Action panels enabling immediate downloads of PDF/CSV report compilations.
- ▪Filtering controls sorting operations details by department or date ranges.
The Architectural Problem
Executives rely on fragmented reports, leading to delayed financial decisions and lack of alignment on key KPIs.
The Implemented Solution
Vanguard consolidates financials, marketing ROI, and operational capacity into a single high-performance cockpit.
Functional Specifications
- [01]
Unified executive KPI dashboard tracking revenue, users, margins, and NPS.
- [02]
Multi-dimensional reports builder with export tools.
- [03]
Timeframe toggles filtering analytics by week, month, YTD, or custom years.
- [04]
Roster board tracking department executives and operational leads.
Systems Architecture
Executive Cockpit: Core dashboard parsing data into high-level indicators and charts.
Query Engine: Dynamic filter logic adjusting metrics based on time and category toggles.
Team Directory: Card registry linking department heads to performance scorecards.
HAVE A SYSTEM TO DESIGN?
We scope and build custom web applications, advanced data visualization systems, and stateful AI dashboards in under 3 weeks.
LET'S DISCUSS YOUR PROJECT