Future Regret Simulator
Behavioral Risk Analytics & Compounding Life Calculator
Live Recording & Interactive Gallery

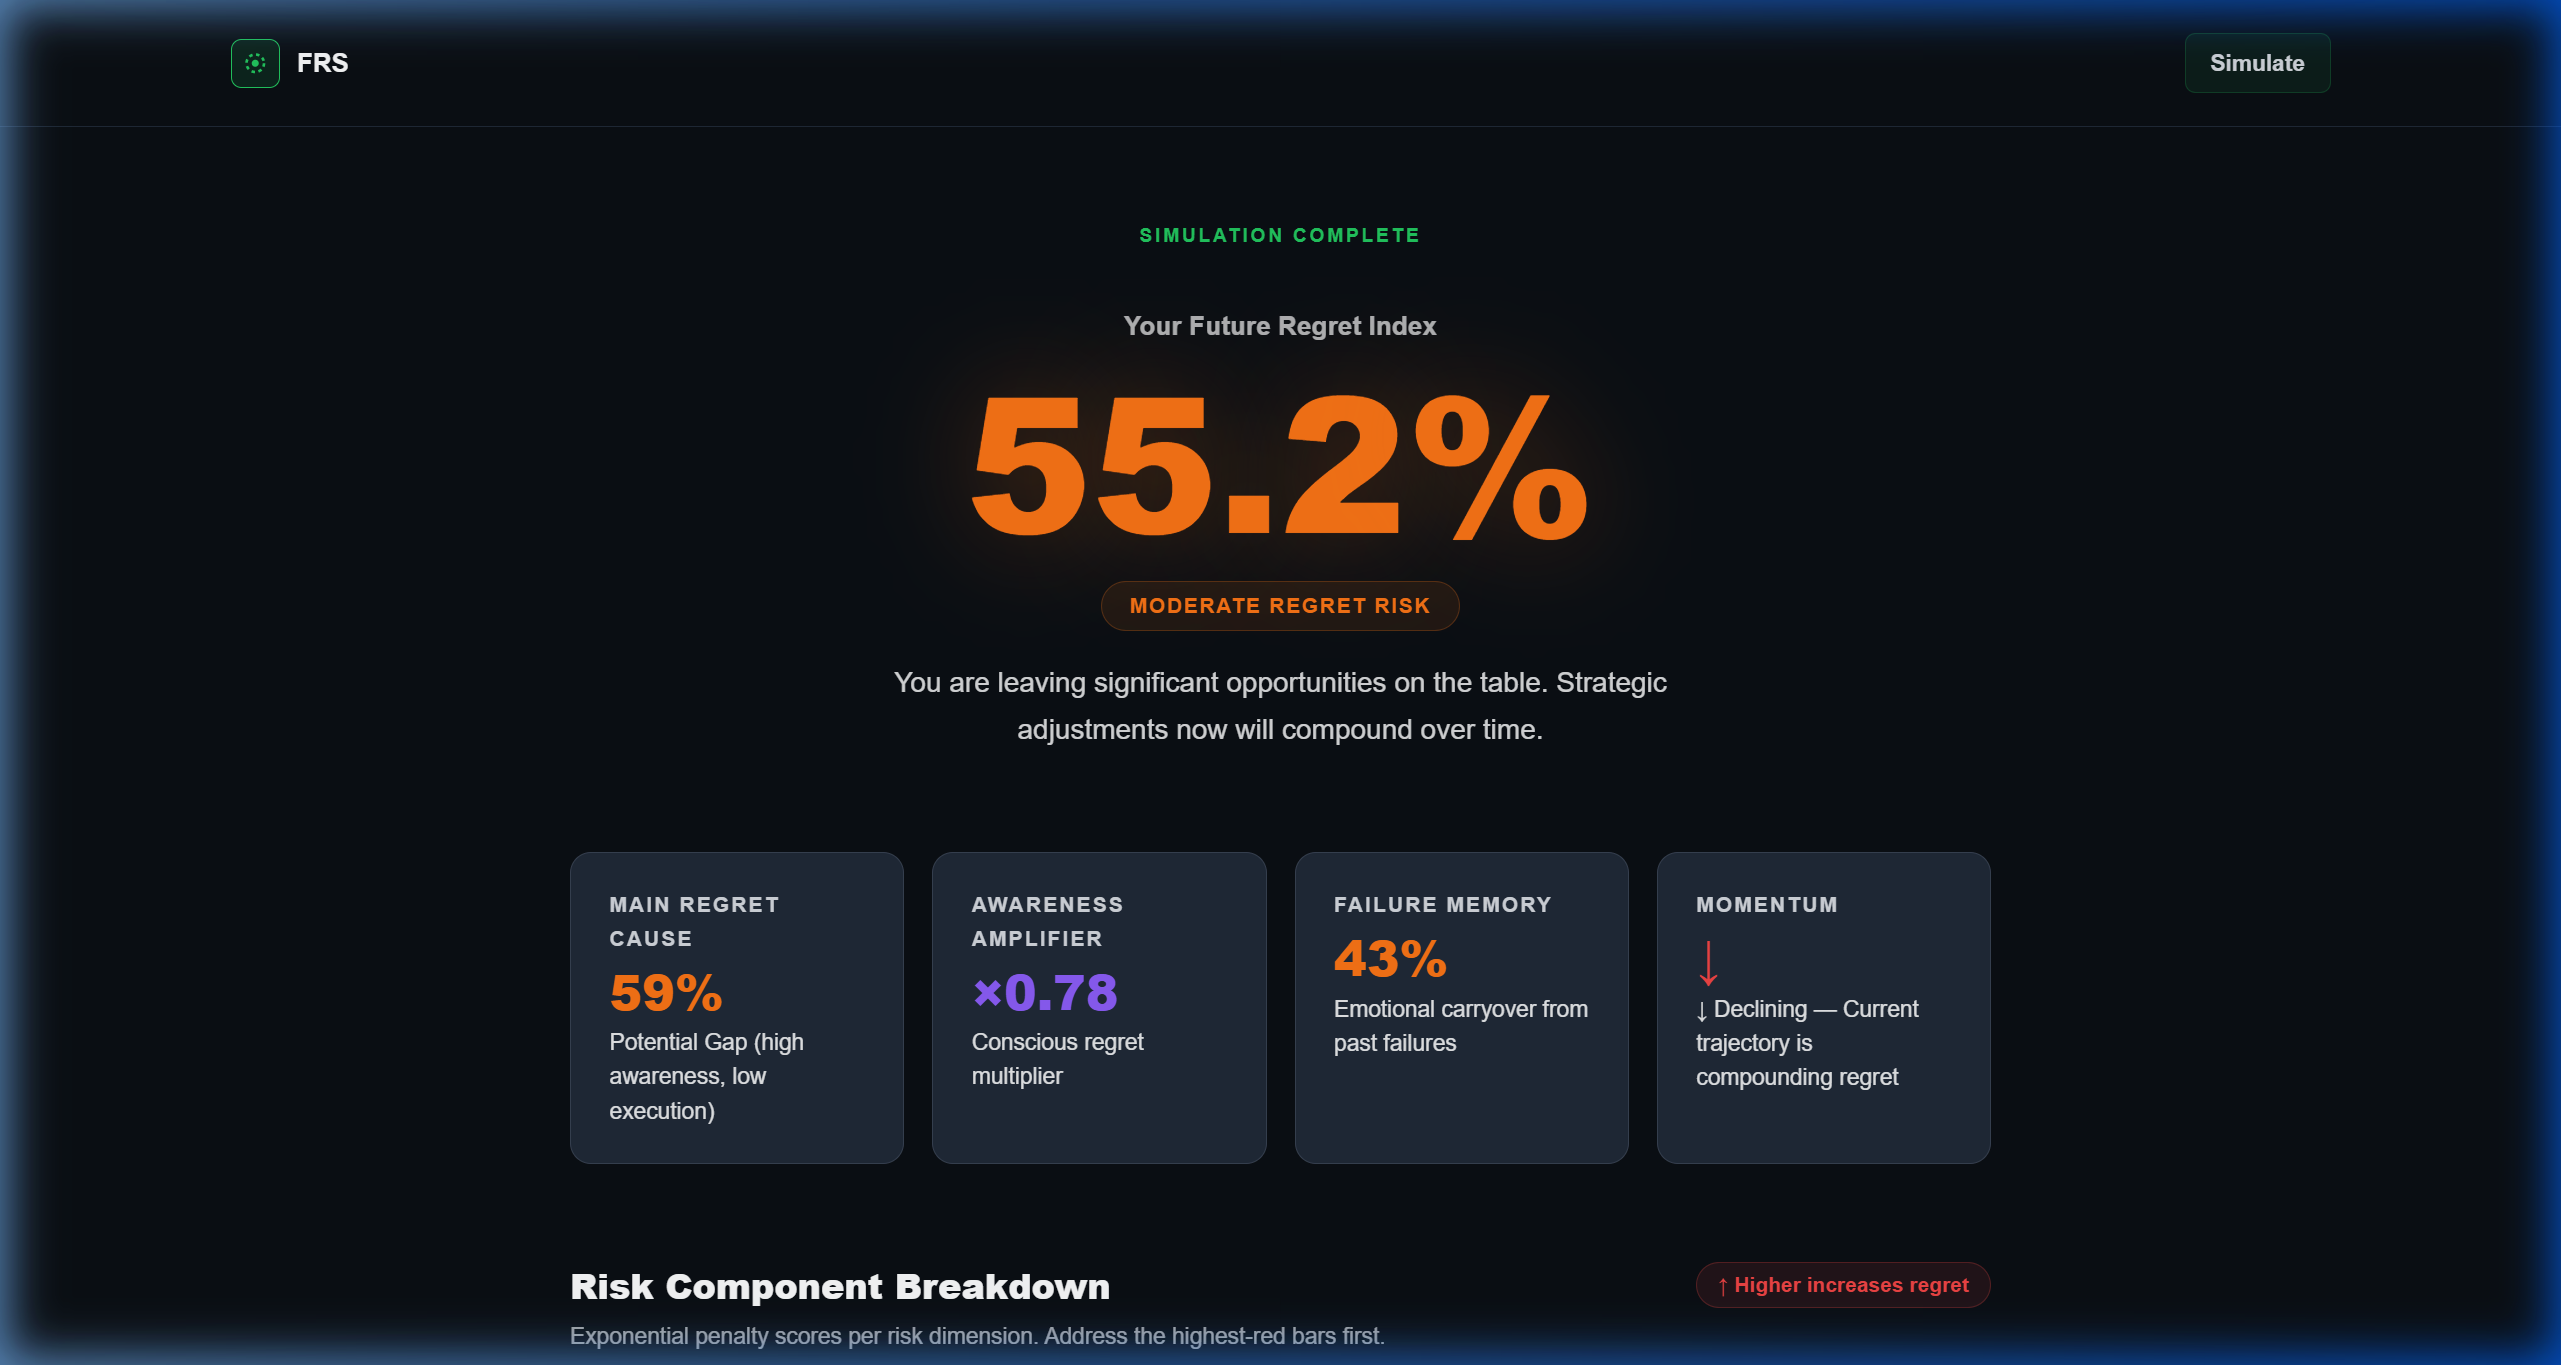
Project History & Context
Future Regret Simulator was developed in partnership with behavioral finance researchers to demonstrate the compounding impact of daily routines on long-term wealth, physical health, and professional fulfillment. While financial advisors use linear compound interest equations, real-life outcomes are heavily non-linear. The app features a 6-step questionnaire mapping behavioral inputs to a complex multi-dimensional risk matrix, and generates a prioritized, actionable improvement plan.
Core capabilities & interface details
Behavioral Diagnostic Interface
A sleek, multi-step diagnostic form capturing user self-assessments across discipline, clarity, health habits, and career alignment.
- ▪Interactive input sliders that update trajectory projections in real-time.
- ▪Dynamic status indicators highlighting category risk levels as you type.
- ▪Glassmorphic design panels featuring smooth hover transitions.
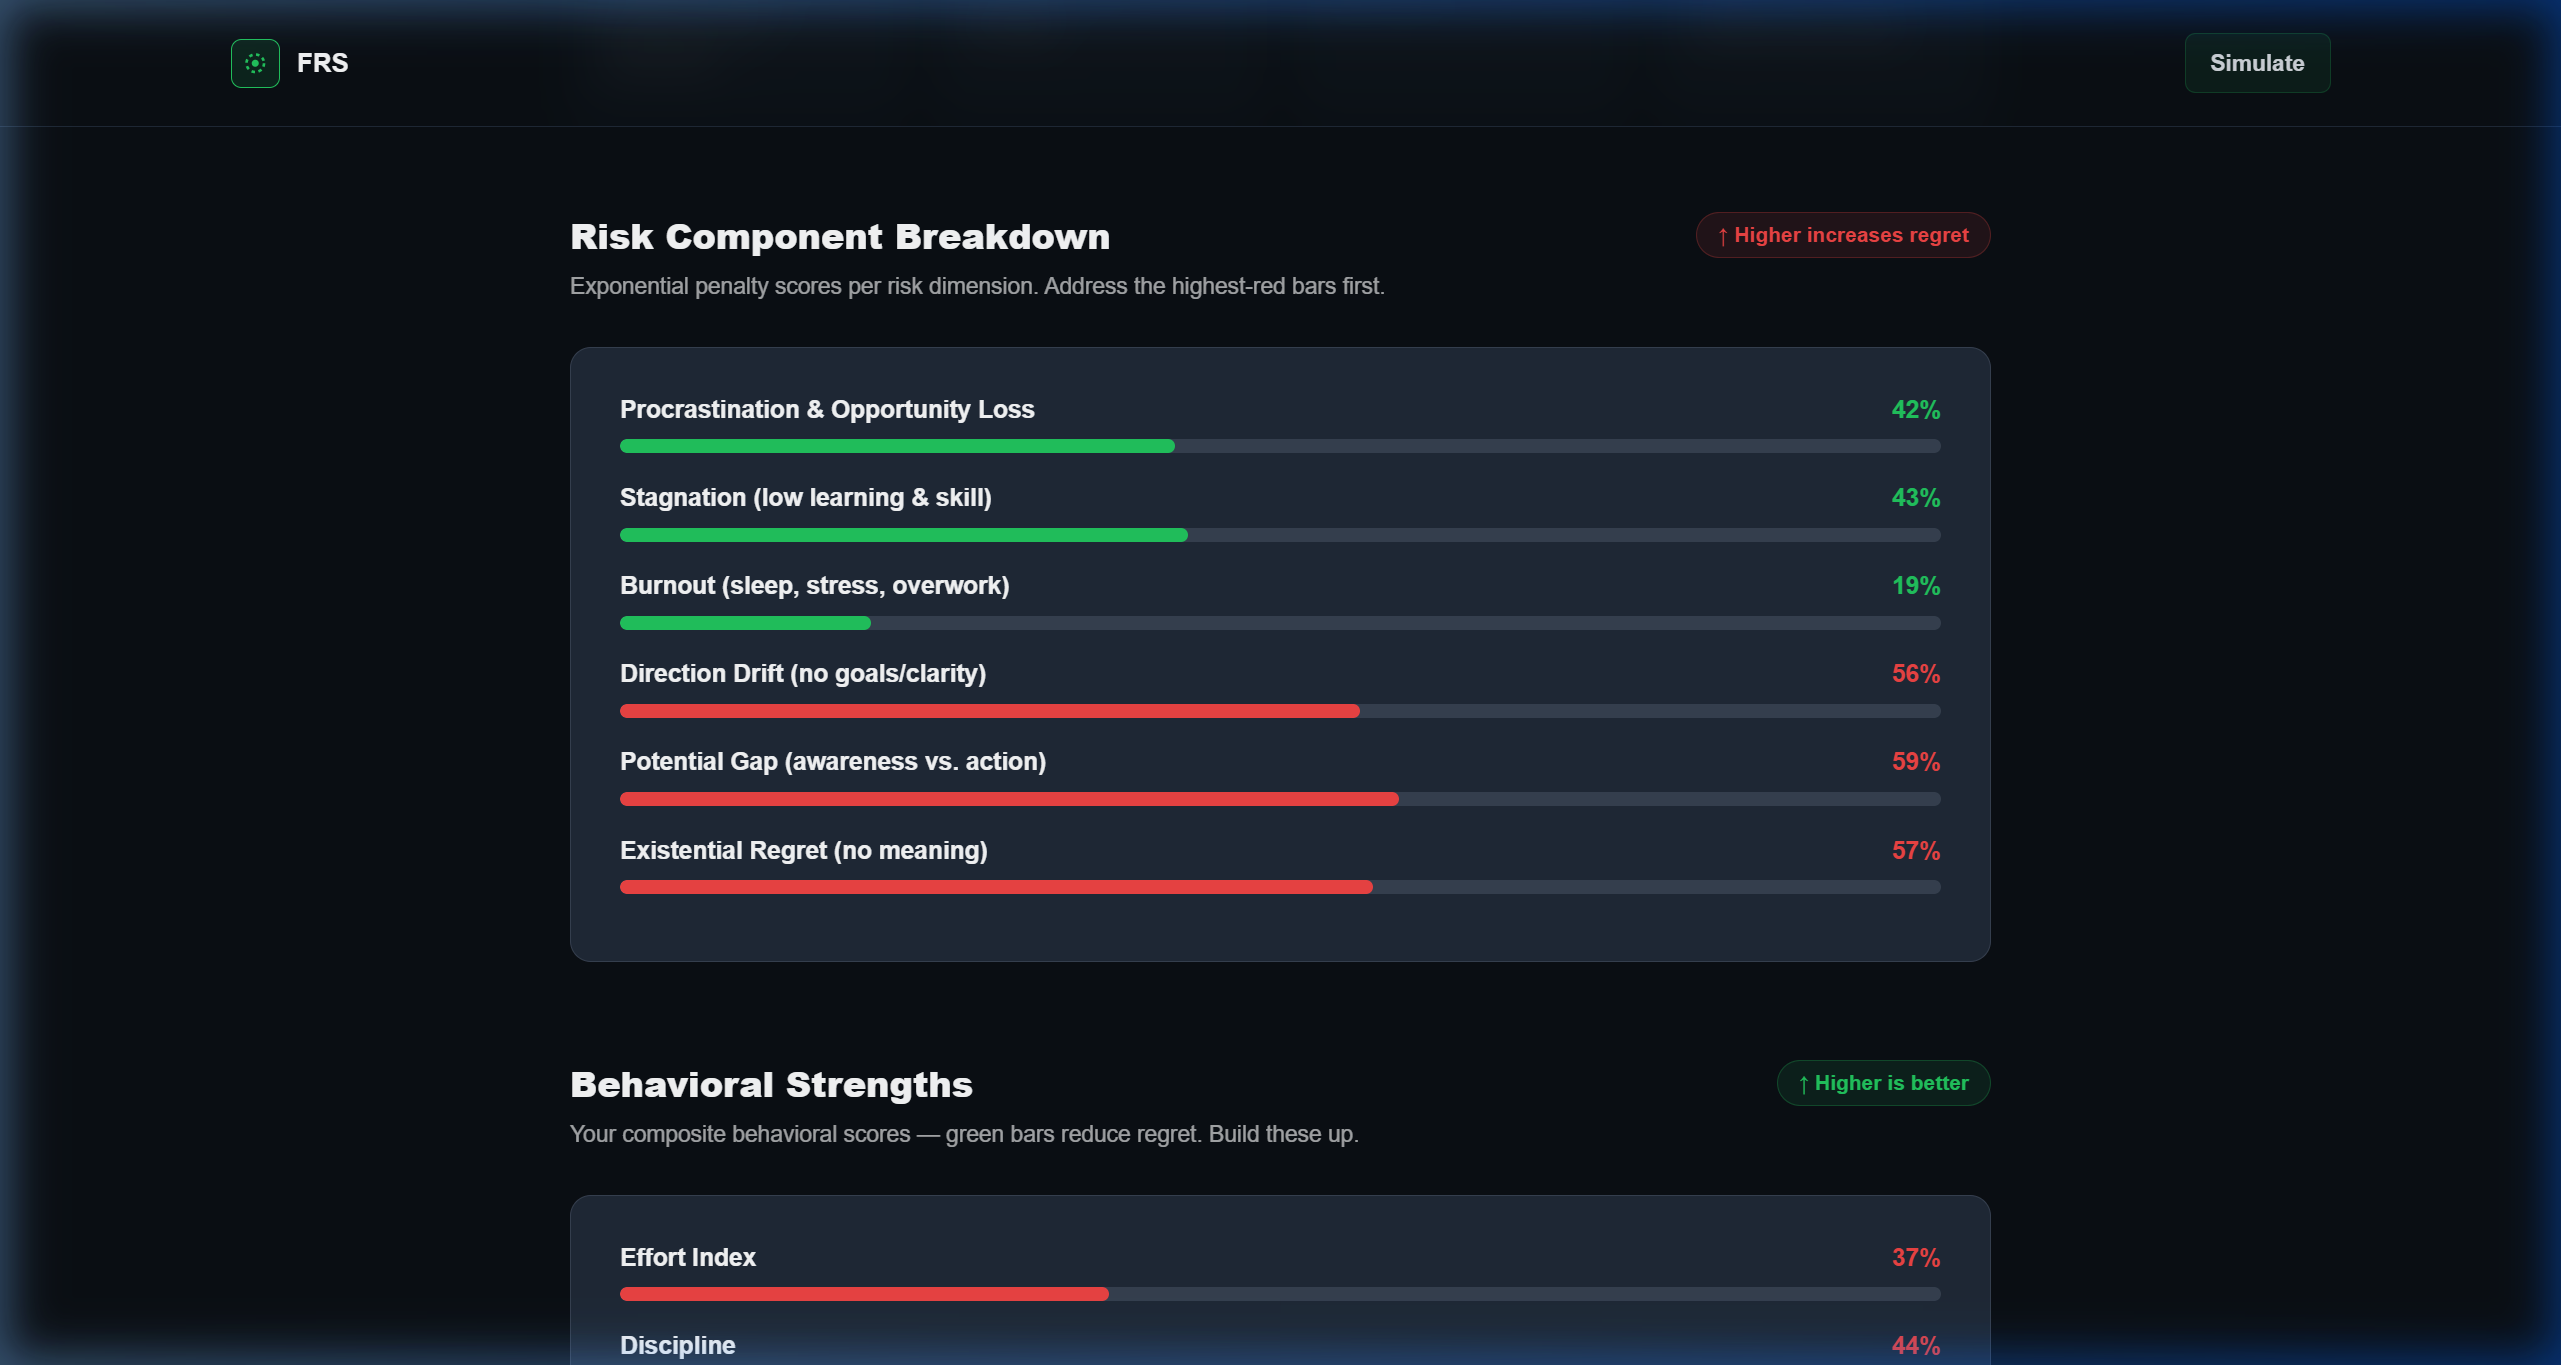
6-Dimensional Trajectory Analytics
An advanced visualization layout plotting users' compound growth projections and regret risk curves across multi-decade horizons.
- ▪Radar charts representing balanced vs skewed lifestyle growth.
- ▪Monte Carlo simulation path overlays projecting optimistic vs pessimistic outcomes.
- ▪Area charts illustrating the compounding cost of bad habits over time.
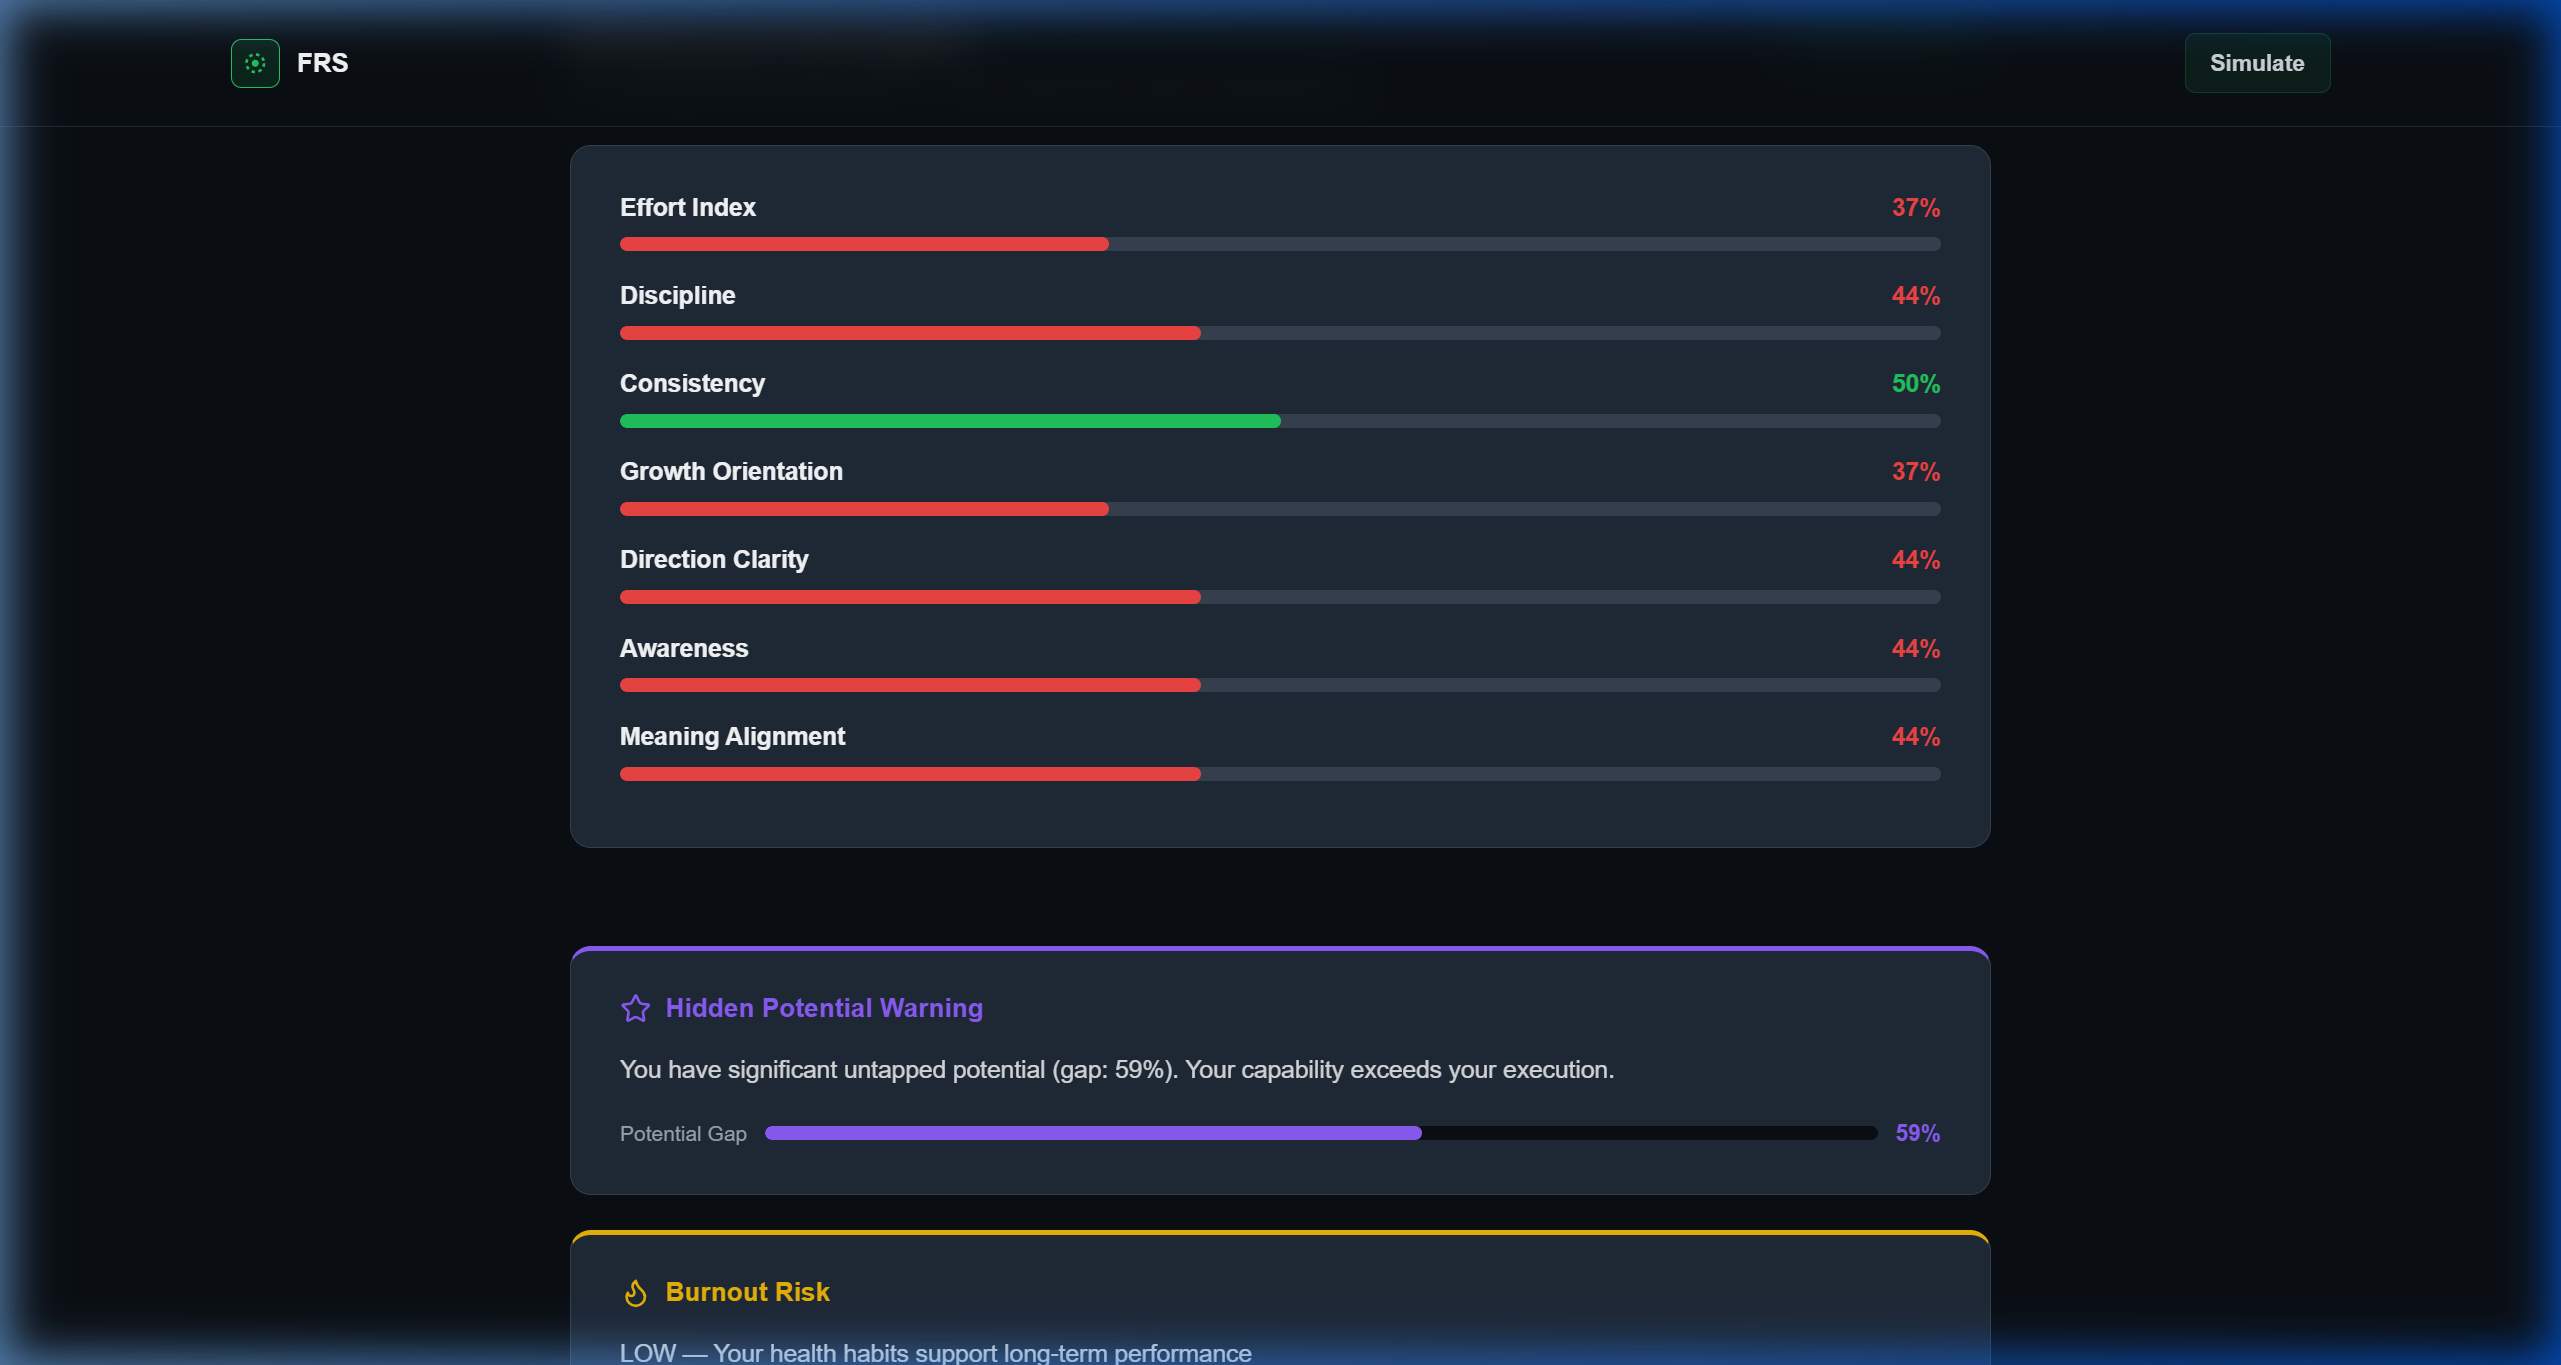
Behavioral Strengths & Friction Points
A summary dashboard grouping user habits into positive growth drivers and immediate lifestyle friction bottlenecks.
- ▪Scorecards comparing user metrics to target behavioral standards.
- ▪Dynamic highlight boxes surfacing severe friction points.
- ▪One-click action cards linking directly to custom improvement tasks.
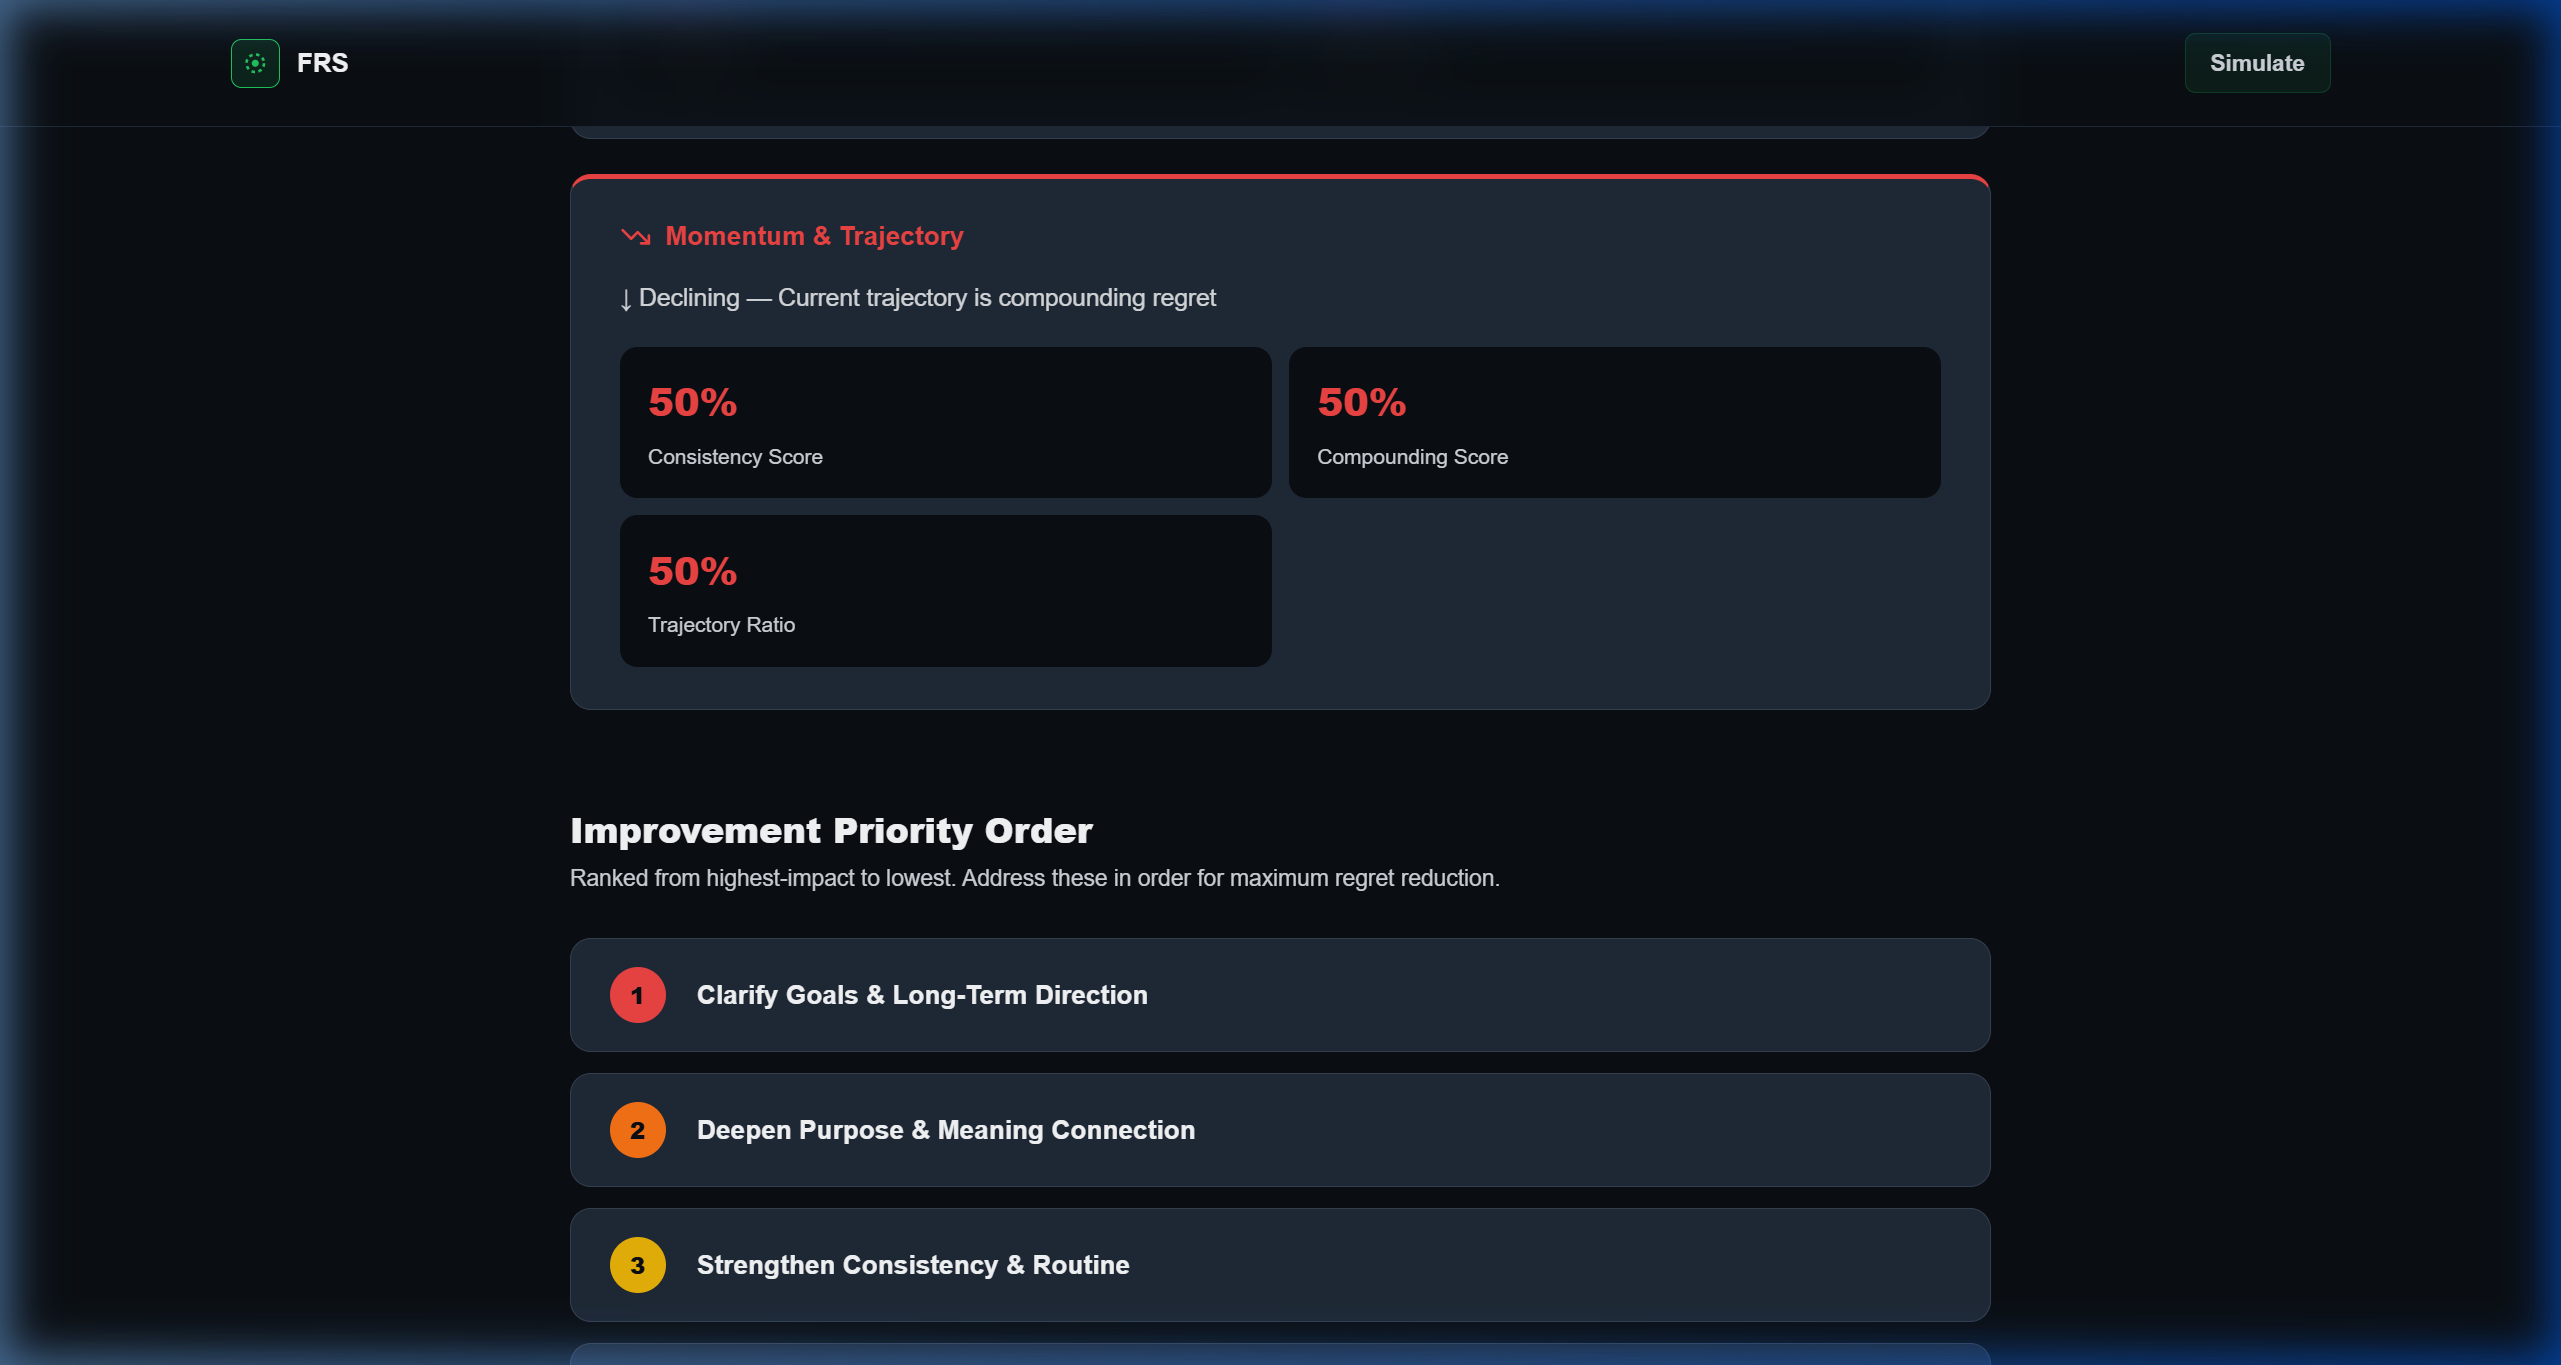
Actionable Prioritized Roadmap
A compiled, sorted checklist of lifestyle changes, ranked by their estimated regret-reduction index to ensure maximum impact.
- ▪Checklist items sorted algorithmically based on user diagnostic scores.
- ▪Difficulty tags detailing estimated effort for each adjustment.
- ▪One-click export options supporting local PDF report compiles.
The Architectural Problem
Traditional wealth planners ignore the non-financial variables (health, career habits, mindset) that dictate a user's ultimate life compounding path and retirement satisfaction.
The Implemented Solution
This simulator creates an interactive risk assessment game where users analyze behavioral friction points and receive direct tactical roadmaps.
Functional Specifications
- [01]
6-step behavioral diagnostic tracking discipline, goal clarity, and energy.
- [02]
Dynamic trajectory forecasting displaying growth compounding curves.
- [03]
Custom prioritized roadmap sorting life adjustments by regret-reduction index.
- [04]
Dark-themed glassmorphism interface with premium micro-animations.
Systems Architecture
Behavioral Engine: Non-linear penalty calculation algorithm determining regret indexes based on slider parameters.
Interactive Chart: Radar and bar charts rendering dynamic risk profiles upon completion of step-form inputs.
Roadmap Compiler: Array sorting logic weighting gaps to output a step-by-step priority improvement list.
HAVE A SYSTEM TO DESIGN?
We scope and build custom web applications, advanced data visualization systems, and stateful AI dashboards in under 3 weeks.
LET'S DISCUSS YOUR PROJECT