Logistics Command Suite
Collaborative Supply Chain Planning, Route Optimization & Automated Rate-Con Operations
Live Recording & Interactive Gallery
Project History & Context
LogiCore Freight OS was engineered for enterprise carrier fleets and freight brokerages to eliminate back-office operational friction. By automating the drag-and-drop ingestion of PDF Rate Confirmations, dispatchers instantly auto-populate load boards, trigger route optimization with toll & weather alerts, and track live driver GPS locations. The system also unifies driver HOS compliance logs and factor billing packages to accelerate cashflow cycles.
Core capabilities & interface details
Fleet Operations Cockpit & ROI Analytics
The main executive dashboard presenting high-level fleet status metrics, weekly hours saved, active route volume, and real-time operational alerts.
- ▪Live ROI metrics tracking hours recovered and document ingestion speed.
- ▪Role-based perspective switcher (Owner, Dispatcher, Safety Director, Billing).
- ▪AI Operations Copilot modal for quick fleet status queries.
Multi-Unit Dispatch Board & Load Assignment
A high-density dispatch management console allowing dispatchers to monitor load statuses, driver assignments, and delivery schedules.
- ▪Filter loads by status: Pending, Dispatched, In-Transit, and Delivered.
- ▪Quick load assignment and driver availability telemetry.
- ▪Real-time status updates with automated shipper notification triggers.
AI Route Optimizer & Weather Telemetry
An interactive routing planner evaluating fuel efficiency, toll calculations, weather warnings, and highway construction alerts.
- ▪Distance and fuel cost estimations based on current diesel prices.
- ▪Real-time weather warning flags and highway delay rerouting.
- ▪Toll pass breakdowns for major commercial freight corridors.
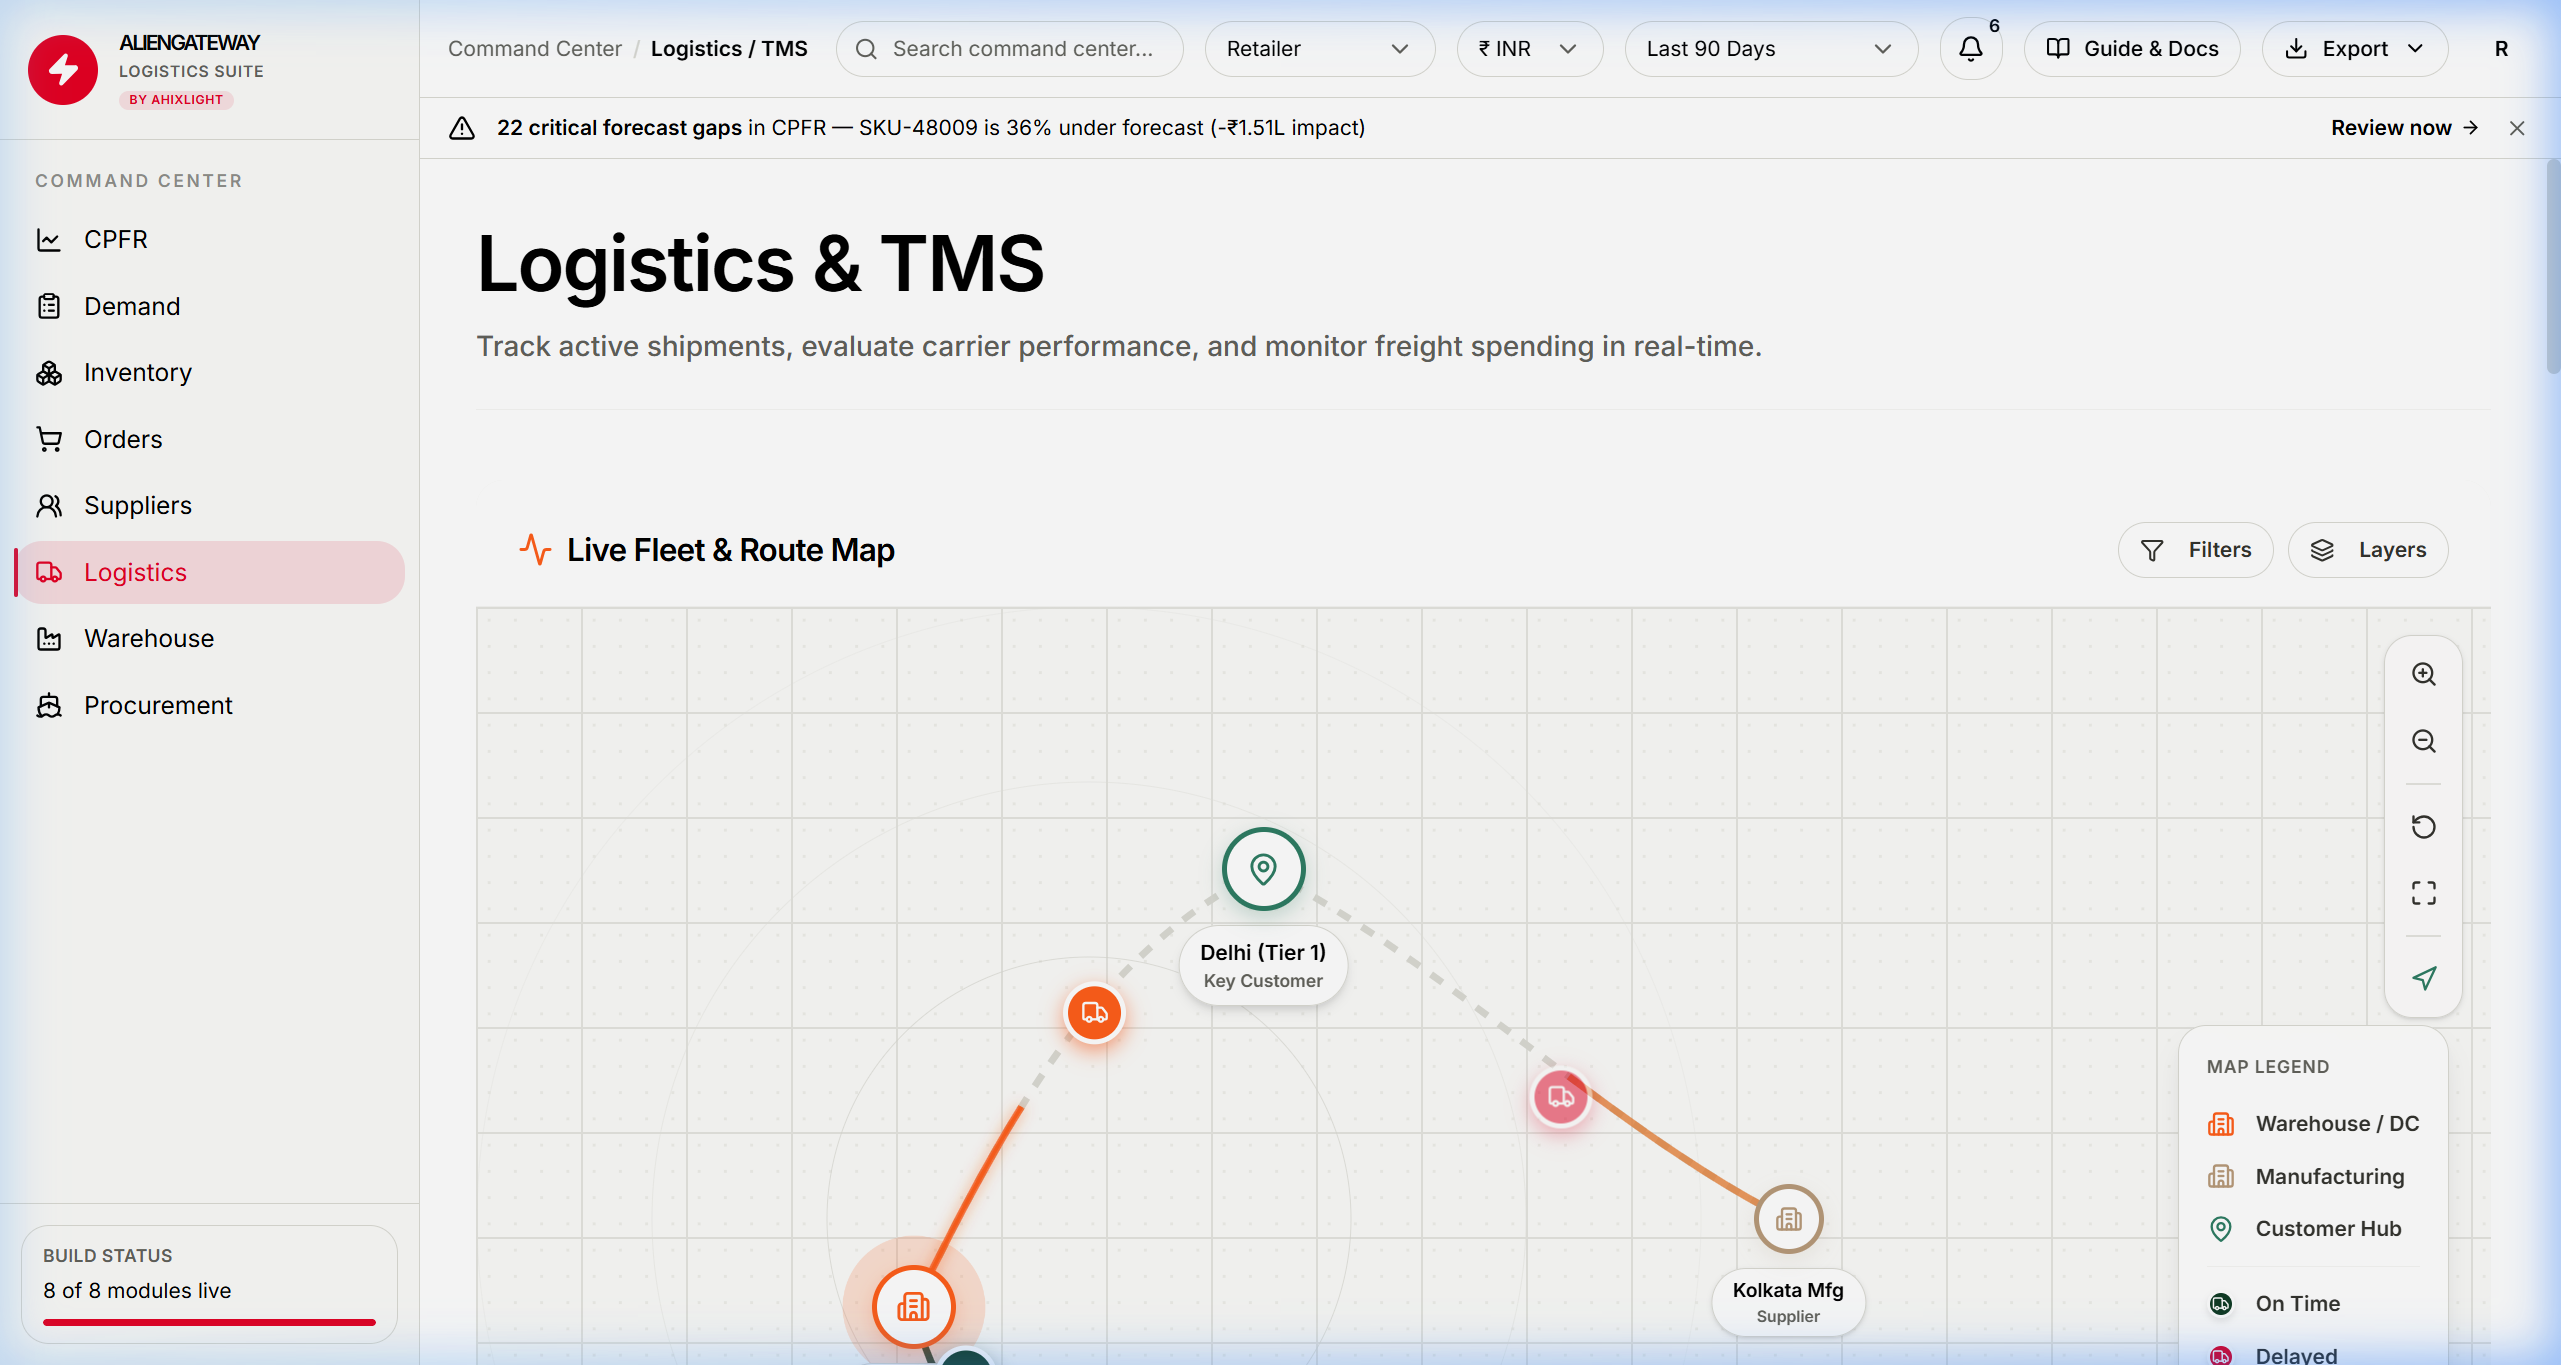
Live Fleet GPS Telemetry & Geofencing
Real-time geographical tracking map plotting active driver coordinates, geofenced customer locations, and HOS clocks.
- ▪Interactive fleet map with active truck locations and speed tracking.
- ▪Geofence entry/exit timestamping for automated detention tracking.
- ▪Driver Hours-of-Service (HOS) remaining duty hour overlays.
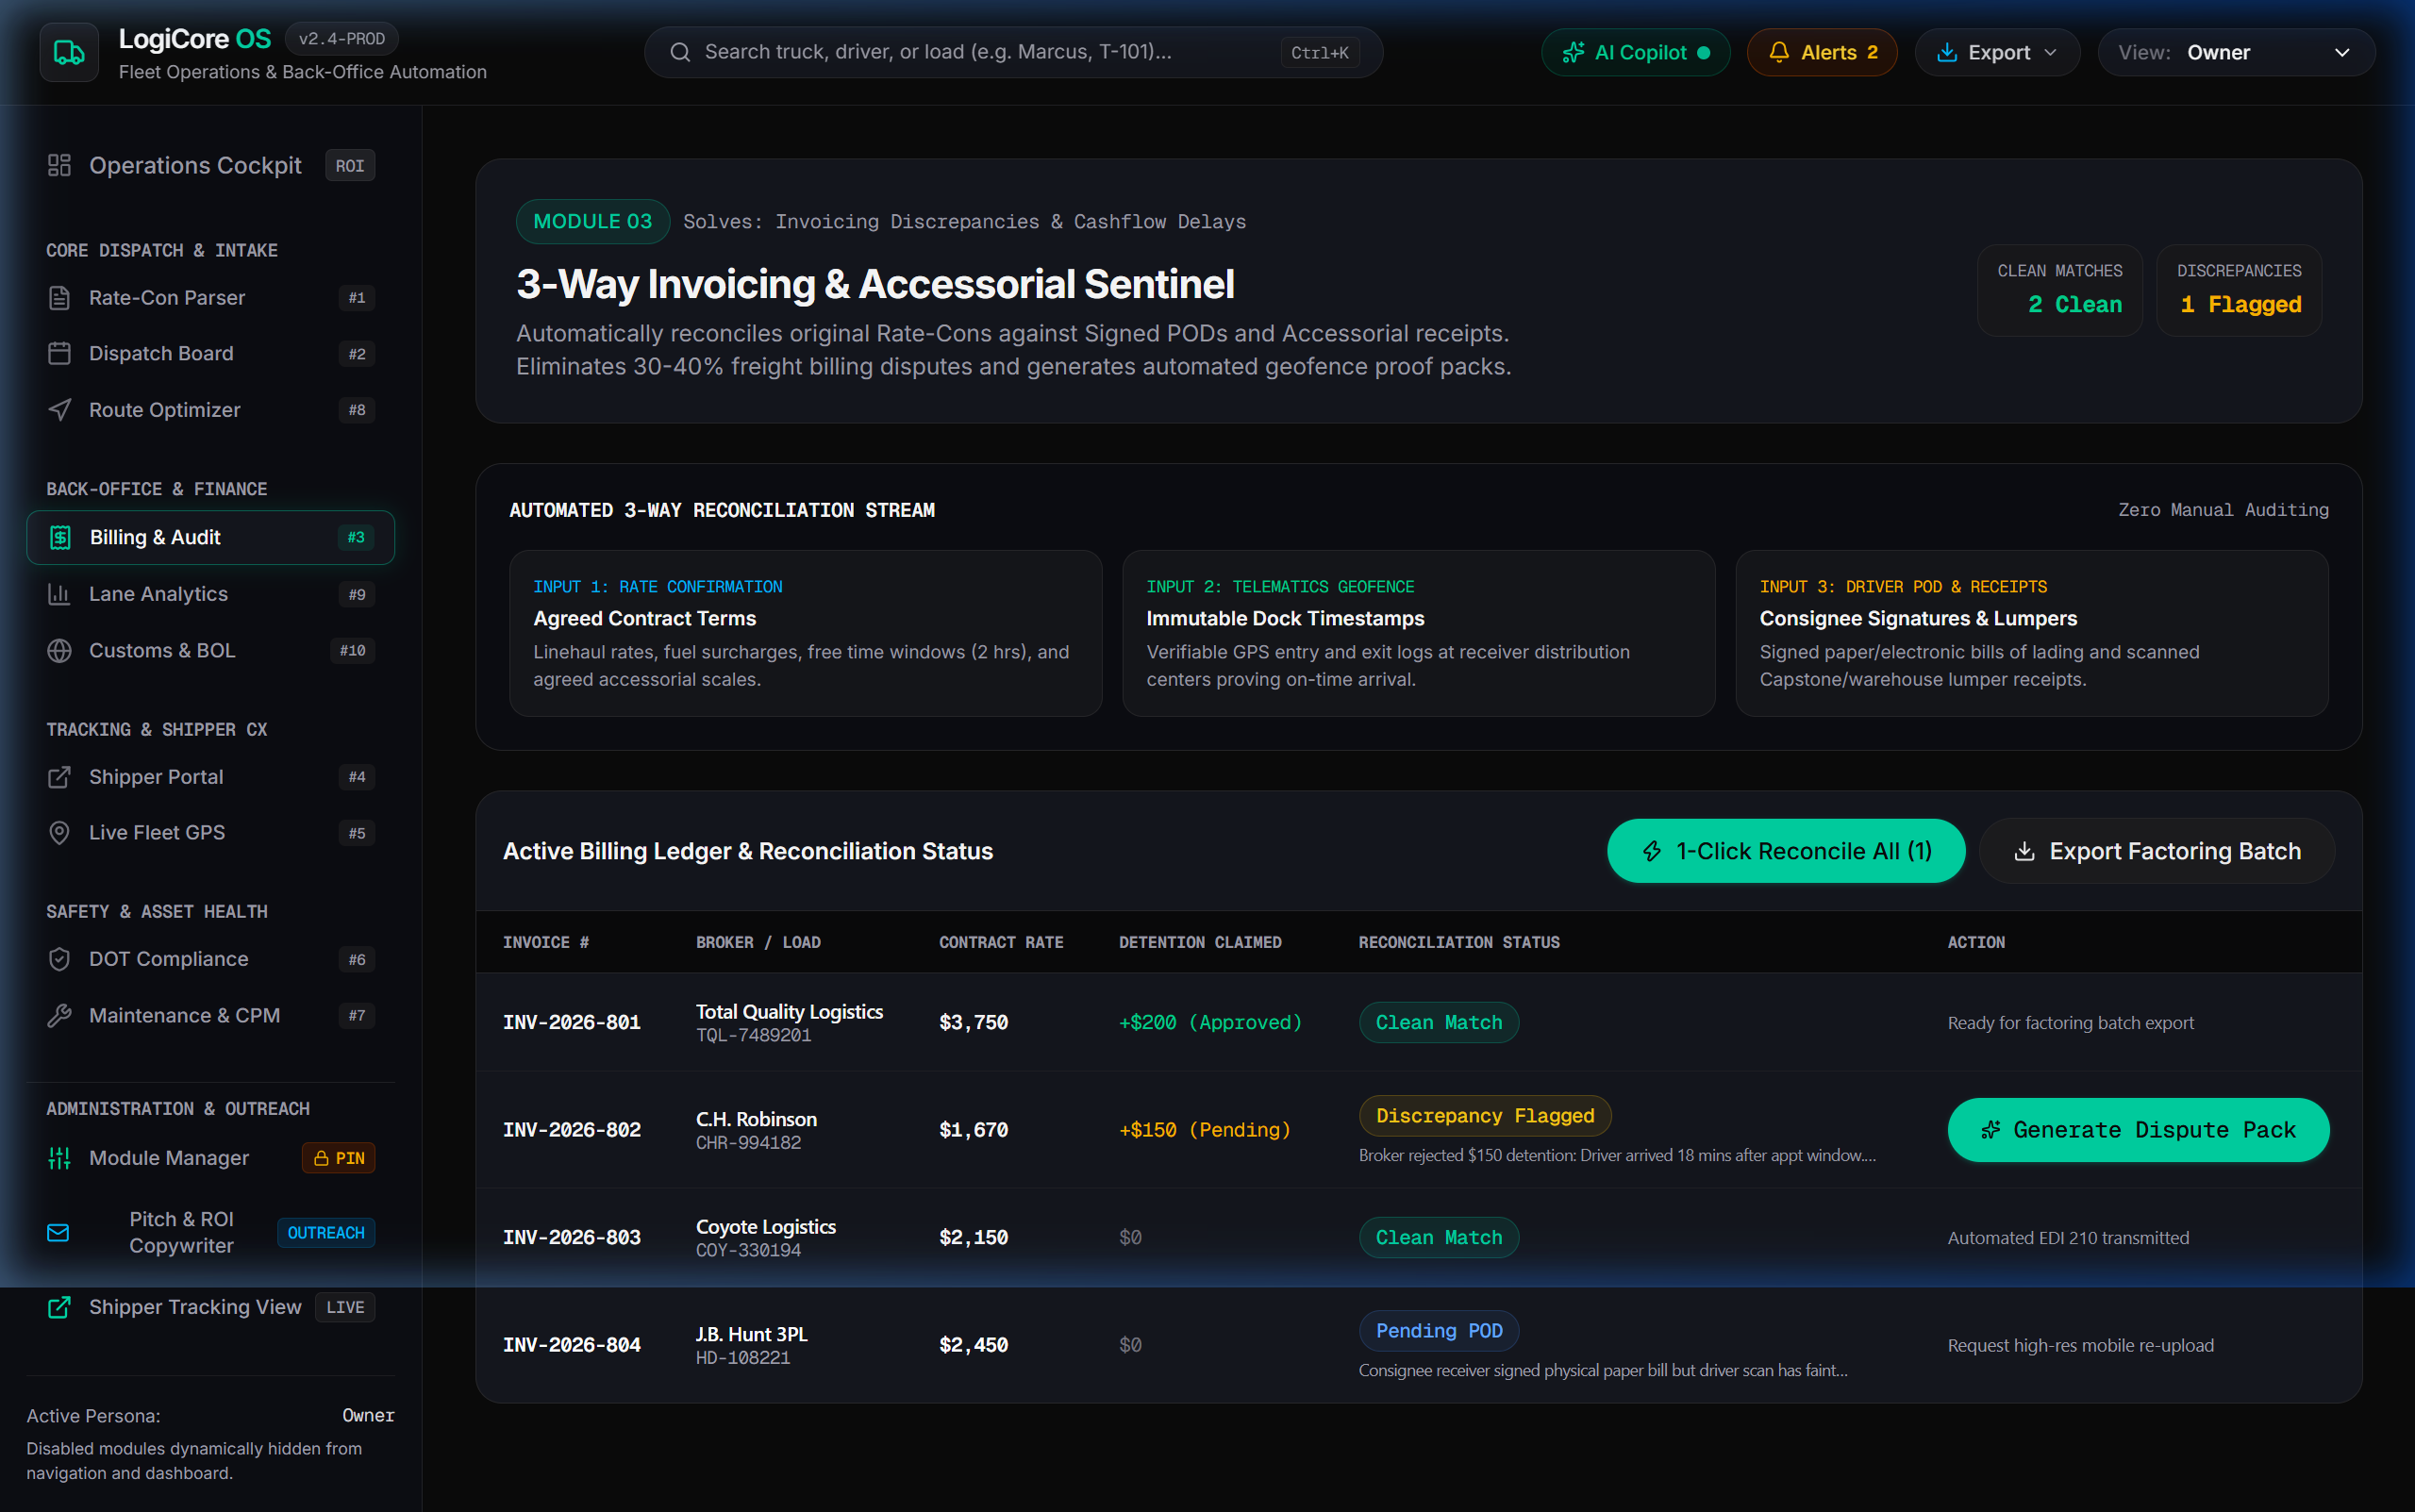
3-Way Billing Audit & Invoice Factor Package
Automated financial reconciliation matching Rate Confirmations against Bills of Lading (BOL) and driver logs.
- ▪Detention auto-billing calculation based on verified GPS timestamps.
- ▪Discrepancy detection flagging rate mis-matches before invoicing.
- ▪1-click factor package export compiling PDF invoices and POD proofs.
AI Rate-Con PDF Parser
An automated document processing workspace that extracts load details, addresses, broker info, and line-haul rates from PDF rate confirmations.
- ▪Drag-and-drop PDF ingestion with sub-second field extraction.
- ▪Automated line-haul rate and fuel surcharge validation.
- ▪Accessorial rule checker flagging lumper, layover, and detention terms.
The Architectural Problem
Fleet dispatchers, freight brokers, and back-office billing clerks waste hundreds of manual hours extracting PDF rate confirmations, tracing delayed shipments, and reconciling detention invoices.
The Implemented Solution
LogiCore unifies automated load ingestion, real-time fleet GPS tracking, automated billing audits, and driver DOT compliance into a single zero-latency operations cockpit.
Functional Specifications
- [01]
AI Rate-Con Parser for 1-click PDF load ingestion and automated accessorial detection.
- [02]
Multi-unit Dispatch Board featuring real-time load assignment and driver telemetry.
- [03]
Route Optimizer with weather/highway warnings, toll estimation, and fuel-efficient re-routing.
- [04]
Automated 3-way Billing Audit (Rate-Con + BOL + Driver Logs) with detention auto-calculation.
Systems Architecture
Rate-Con Extraction Pipeline: High-speed OCR and layout text parsing extracting load details, origin/destinations, and rate terms.
Fleet Telemetry Engine: Real-time GPS stream mapping driver locations, geofences, and Hours-of-Service (HOS) clocks.
3-Way Billing Auditor: Automated cross-validation matching Rate-Con rates against POD documents and accessorial charges.
HAVE A SYSTEM TO DESIGN?
We scope and build custom web applications, advanced data visualization systems, and stateful AI dashboards in under 3 weeks.
LET'S DISCUSS YOUR PROJECT