Project & Team Management Platform
Staff Allocation & Project Profit Margin Console
Live Recording & Interactive Gallery

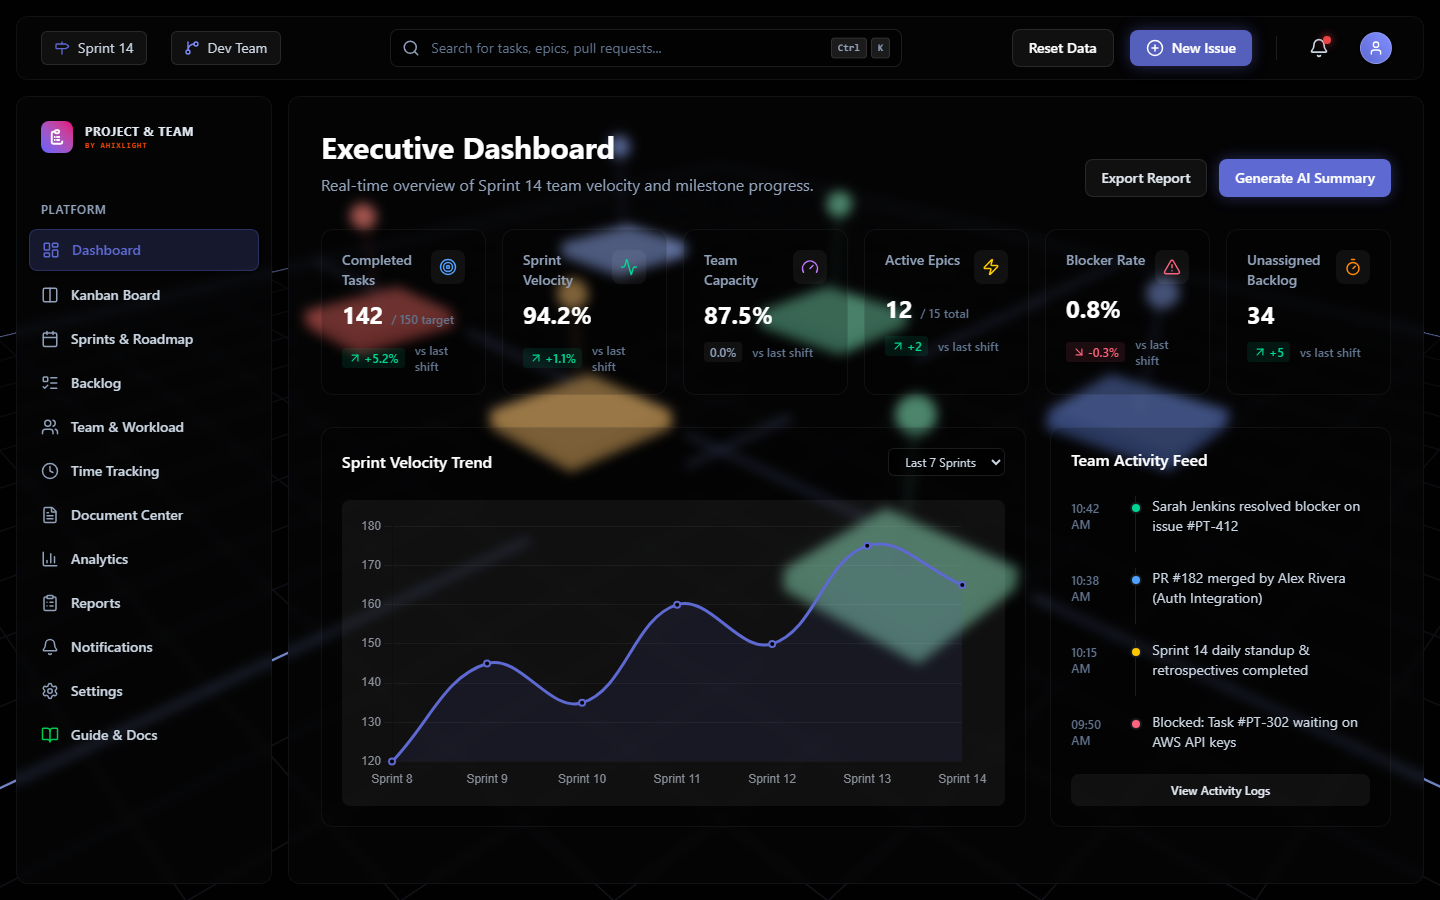


Project History & Context
Vortex Project Management was developed to restore sprint predictability. The workspace integrates task backlogs, team workloads, time sheets, and milestone roadmaps in a single workspace. Managers can allocate tasks and adjust resources while engineers receive clean, keyboard-navigable boards.
Core capabilities & interface details
Sprint Operations Cockpit
The primary control dashboard listing sprint progress bars, team workload gauges, and priority task alerts.
- ▪Dynamic progress meters measuring active sprint task completions.
- ▪Team capacity gauges auditing points assignments per engineer.
- ▪High-priority issue banners highlighting critical blockers.
Drag-and-Drop Task Board
An interactive scrum board organizing backlog issues, assignees, priorities, and description files.
- ▪Dynamic status columns updating task locations across Kanban boards.
- ▪Category tag filters grouping issues by technical features.
- ▪One-click modals editing descriptions, assignees, and estimations.
Interactive Delivery Timeline
A milestone roadmap planning epic targets, Gantt dependencies, and sprint releases.
- ▪Gantt charts aligning milestones with sprint windows.
- ▪Status indicators tracking completions of major functional requirements.
- ▪Interactive zoom scales sorting timeline views by weeks, months, or quarters.
The Architectural Problem
Spreadsheet planning causes burned-out senior staff, missed delivery deadlines, and lost project profit margins.
The Implemented Solution
Vortex automates staff scheduling, tracks active project budgets in real time, and flags team capacity bottlenecks before deadlines slip.
Functional Specifications
- [01]
Interactive scrum boards with customizable statuses and task cards.
- [02]
Automatic sprint burndown charts tracking point velocity.
- [03]
Resource allocation overview displaying team workloads and capacity limiters.
- [04]
Document center integration organizing meeting minutes and specs.
Systems Architecture
State Management: Lightweight client-side store updating task cards across customizable lanes.
Burndown Calculator: Telemetry algorithm computing velocity points per sprint iteration.
Team Capacity Engine: Workload tracking matrices reflecting engineer availability and assignments.
HAVE A SYSTEM TO DESIGN?
We scope and build custom web applications, advanced data visualization systems, and stateful AI dashboards in under 3 weeks.
LET'S DISCUSS YOUR PROJECT